Current Data Disparity
While consistent state-level data exist on fatal firearm violence including homicides and suicides, researchers have lacked reliable estimates of nonfatal firearm injuries. The Centers for Disease Control and Prevention (CDC) release annual mortality data through the Underlying Cause of Death database on their WONDER platform with specific codes for firearm mortality available to the public since 1999.
However, thousands of nonfatal firearm injuries occur every year that are not captured within that database. Roughly 108 people die every day from firearm violence, but three times as many are injured. A large portion of these injuries are nonfatal and the victims may suffer long-term consequences and subsequent health issues, putting further strain on not only health and mental health care resources but communities writ large. Existing research suggests that nonfatal firearm injuries disproportionately impact people of color; the rate of firearm injury among the Black community is ten times higher than among white people. Without more detailed information on firearm injuries, researchers struggle to calculate the full cost and societal burden of gun violence in our nation and evaluate existing policies intended to reduce firearm injuries. Most importantly, it is difficult to understand the actual number of people impacted—both directly and indirectly—by gun violence each year.
Roughly 108 people die every day from firearm violence, but three times as many are injured.
New Data on Firearm Injuries
In April 2021, the RAND Corporation released a report on Inpatient Hospitalizations for Firearm Injury with an accompanying dataset that estimates state-level firearm injury hospitalizations from 2000 to 2016 using data from the State Inpatient Databases (SID). Their analysis revealed distinct differences in firearm injury hospitalizations between U.S. states. In the 17 years of data, the average firearm injury hospitalization rate per 100,000 was highest in Louisiana (24 per 100,000 people) and lowest in Hawaii (2 per 100,000 people). It is important to note that some number of hospitalized people captured in the RAND estimates died from their injuries and may also be counted in the CDC mortality data.
Terms
Firearm Injury Hospitalization Rate: the number of firearm injuries requiring hospitalization per 100,000 residents.
Firearm Death Rate: the number of deaths where a firearm was the underlying cause of death per 100,000 residents, age-adjusted.*
* Age-adjusted death rates are weighted averages of the age-specific death rates, where the weights represent a fixed population by age. They are used to compare relative mortality risk among groups and over time. An age-adjusted rate represents the rate that would have existed had the age-specific rates of the particular year prevailed in a population whose age distribution was the same as that of the fixed population.
Fatal & Nonfatal Firearm Violence Among States in the Regional Gun Violence Research Consortium
Regional Insights
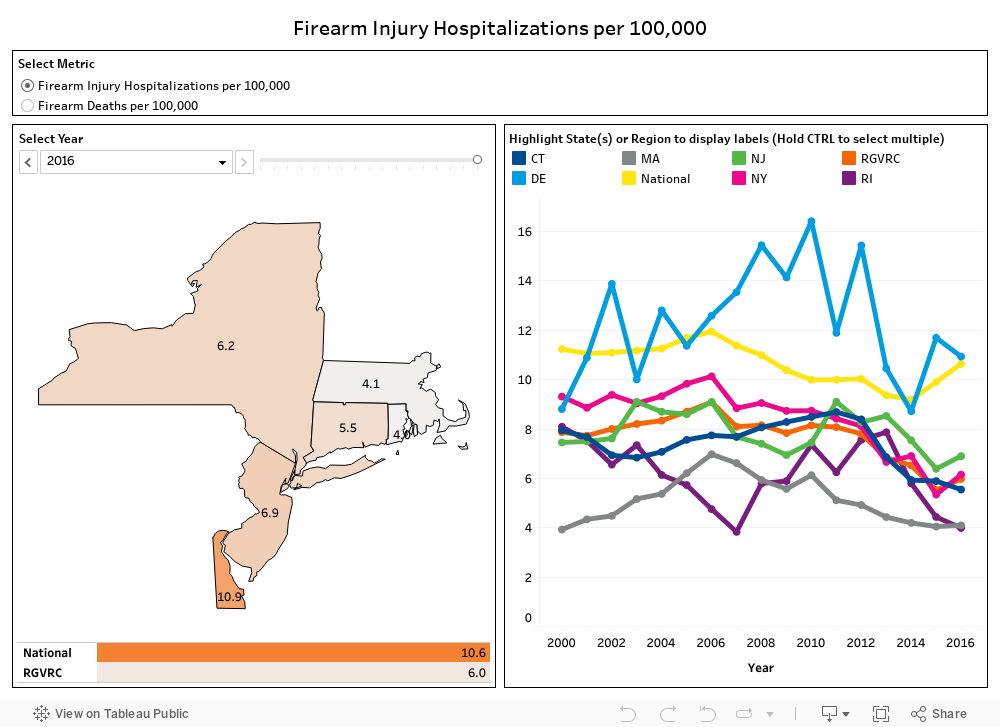
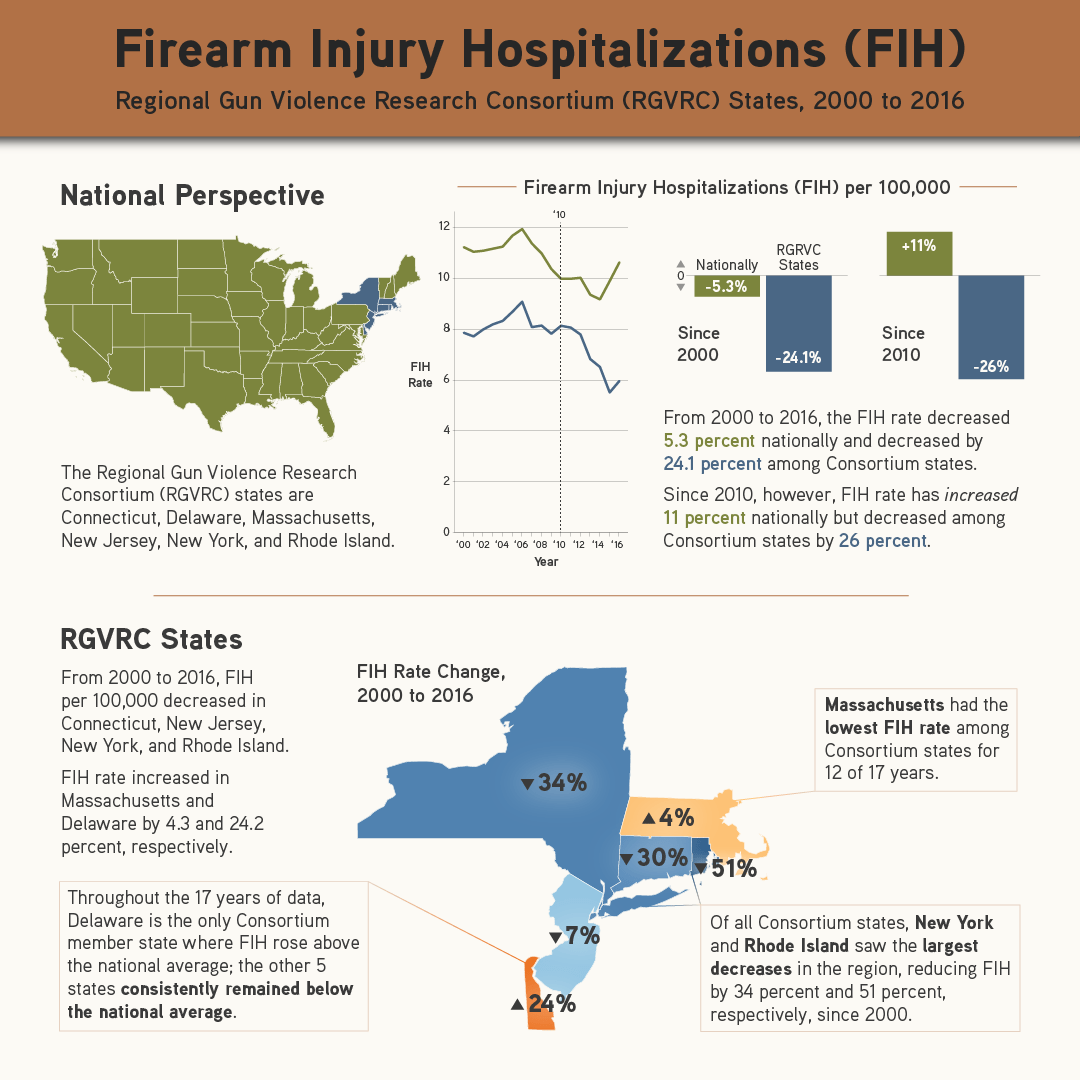
The Regional Gun Violence Research Consortium (RGVRC) used this new dataset to analyze the member states of the Consortium—Connecticut, Delaware, Massachusetts, New Jersey, New York, and Rhode Island—and found that many of the member states were below the national average for firearm injury hospitalization rate, as displayed in Figure 1. In addition, almost all of the Consortium states ranked below the national average in firearm mortality. The firearm injury and death rates in these states are generally associated with the strength of their gun laws, as all six states occupy spots in the top 11 strongest gun laws in the nation—CT (3rd), DE (11th), MA (5th), NJ (2nd), NY (6th), and RI (9th), according to analysis by advocacy organizations. Typically, the overall strength of a state’s gun laws is inversely correlated with firearm violence, meaning that as the strength of state gun laws decreases, their firearm injury and death rates generally increase. For example, Mississippi, which has the weakest gun laws in the nation, has the second highest firearm death rate. The states that have fewer firearm deaths and injuries also tend to be the most active in gun violence law and policy.
2016 Firearm Injuries & Deaths Among States in the Regional Gun Violence Research Consortium
| State | Firearm Injury Hospitalization Rate | Rank | Firearm Death Rate | Rank |
|---|---|---|---|---|
| Connecticut | 5.5 | 40 | 4.8 | 46 |
| Delaware | 10.9 | 20 | 11.7 | 35 |
| Massachusetts | 4.1 | 45 | 3.6 | 50 |
| New Jersey | 6.9 | 32 | 5.4 | 45 |
| New York | 6.2 | 37 | 4.6 | 47 |
| Rhode Island | 4.0 | 46 | 4.6 | 47 |
| National Rate | 10.6 | 12.0 |
Some notable findings include:
- On aggregate, the firearm death rate for the Consortium states is less than half the national rate, according to population-controlled metrics.
- Since 2000, as firearm death rates nationally have risen by 18 percent, the Consortium’s regional rates have fallen by 2 percent.
- From 2000 to 2016, the firearm death rate in New York fell by 21 percent, the largest decrease of any Consortium state.
ABOUT THE AUTHORS
Nicholas J. Simons is project coordinator at the Rockefeller Institute of Government and helps lead the Regional Gun Violence Research Consortium.
Joseph Popcun is director of policy and practice at the Rockefeller Institute of Government and executive director of the Regional Gun Violence Research Consortium.