November 14, 2018
The debate over education funding often centers around district-level spending. For instance, national per-pupil spending data offered by the U.S. Census Bureau focuses on the average per-student spending at the district level. New York spends more per pupil than any other state in the nation — $22,366 versus $11,762 per student nationally.[1] Every school district in New York spends more per student than the national average.[2] Yet, there are variations among districts — largely depending on communities’ relative wealth to help fund their school district. State aid attempts to equalize local wealth capacity among districts, which is evident by the fact that more than 72 percent of the state education aid increase goes to the neediest districts, while a little more than 5 percent of the increase goes to the wealthiest districts.[3] Even with spending disparities among districts across the state, every school district in New York spends more per student than the national average. Within districts, however, is aid distributed equitably to individual schools?
There are often many individual schools within a district. The New York City school district — the largest district in the United States — operates more than 1,600 schools. The average per-pupil spending in New York City is more than $24,000 — higher than the New York State average, yet the district has more than 500 low-performing schools.[4] But it’s not just New York City; that is but one example across New York State. The Rockefeller Institute of Government recently released a report, Does Education Aid Flow to the Schools that Need it the Most?, which analyzed inequities in school funding in an attempt to get a better sense of how government spending on education flowed to individual schools within districts. At the time we issued the report there were no apples-to-apples individual school-level spending data available.
The federal Every Student Succeeds Act[5] was one avenue where such funding data would eventually become available. Another was the recently adopted school transparency reporting requirements proposed by Governor Cuomo and adopted by the state legislature.[6] In 2018, districts must report individual school-level data to the New York State Division of the Budget and State Education Department if they have four or more schools and receive more than 50 percent of their total revenue from state aid or they are located in a city with a population of more than one million. A total of seventy-six school districts are required to submit detailed spending data this year.[7]
Currently, individual school-level data have been made available for the Big 5 school districts: Buffalo, New York City, Rochester, Syracuse, and Yonkers.[8] Now that we have individual school-level spending data, we can take an apples-to-apples deep dive into the hundreds of individual schools within these districts.
Our preliminary findings suggests that more needs to be done at the district level to equalize per-pupil funding within the districts, especially when dealing with the highest-poverty schools.
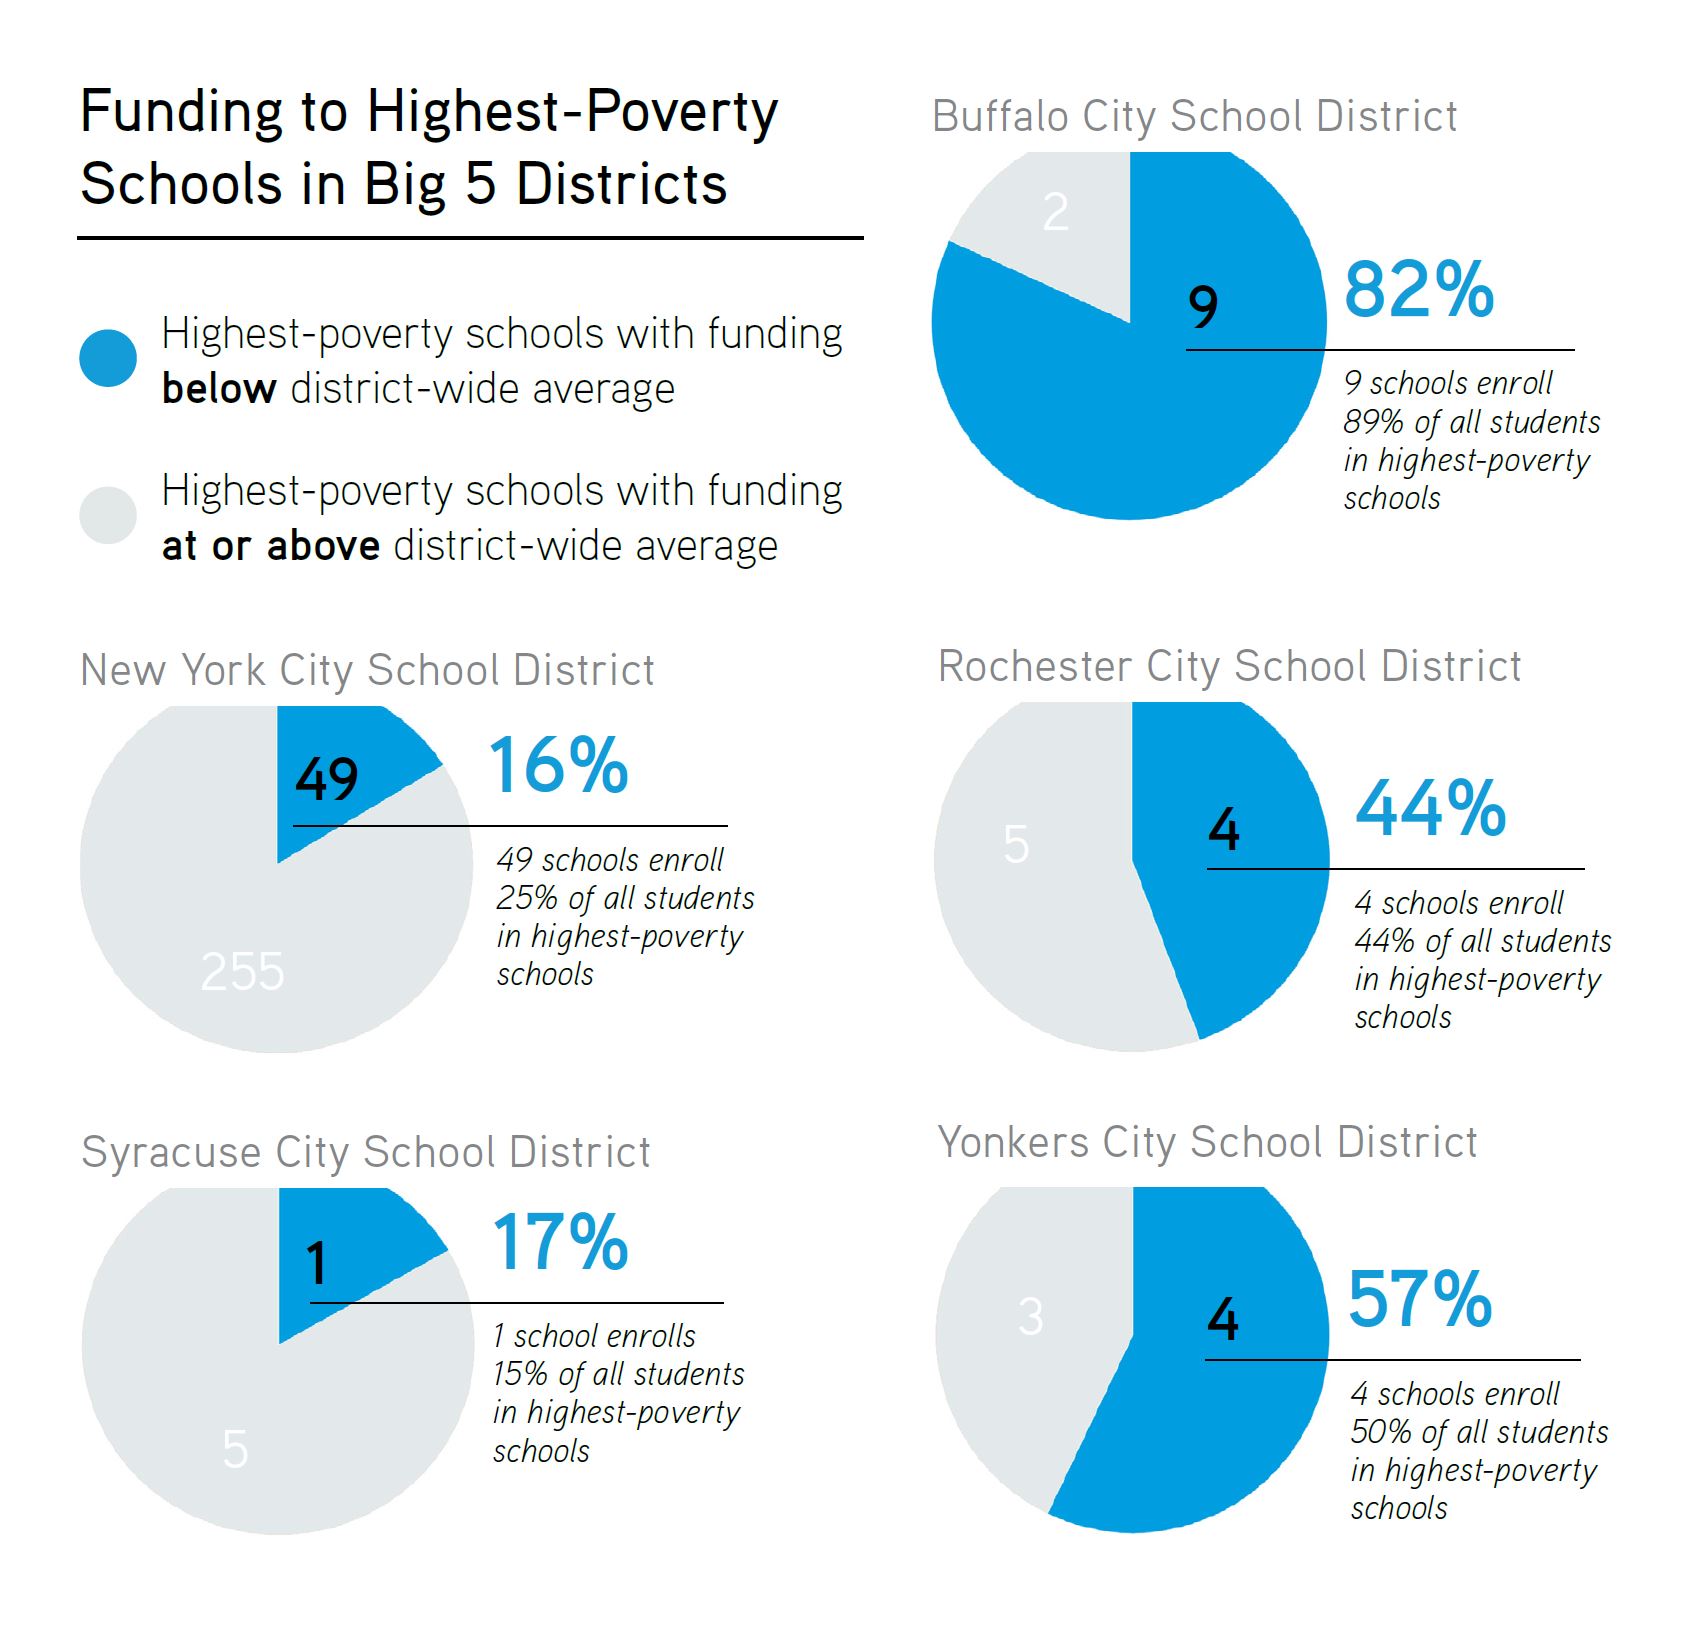
Compared to the average district-wide per-student spending:
+ Buffalo City School District: Nine of the eleven — more than three-quarters — of the schools with the highest poverty have funding below the district-wide average. The nine schools enroll 89 percent of all students in the highest-poverty schools.
+ New York City School District: Forty-nine of the 304 — nearly one-fifth — of the poorest schools have per-pupil funding below the district-wide average. The forty-nine schools enroll 25 percent of all students in the highest-poverty schools.
+ Rochester City School District: Four of the nine — roughly half — of the highest-poverty schools are funded below the district-wide average. The four schools enroll 44 percent of all students in the highest-poverty schools.
+ Syracuse City School District: One of the six highest-poverty schools — nearly a fifth — is funded below the district-wide average. The school enrolls 15 percent of all students in the highest-poverty schools.
+ Yonkers City School District: Four of the seven — more than half — highest-poverty schools in the district are funded below the district-wide average. The four schools enroll 50 percent of all students in the highest-poverty schools.
Moreover, when accounting for the greater educational needs of the children attending the districts’ highest-poverty schools, using the current state Foundation Aid formula’s weightings for poverty, English language learners (ELL), and students with disabilities (SWD), the disparity is starker and suggests that the districts are not allocating their state and local education aid in the most equitable fashion.
When measured against the Foundation Aid formula:
+ Buffalo City School District: The highest-poverty schools get 26 percent less per pupil on average than the district’s wealthiest schools.
+ New York City School District: The highest-poverty schools get 12 percent less per pupil on average than the district’s wealthiest schools.
+ Rochester City School District: The highest-poverty schools get 2 percent less per pupil on average than the district’s wealthiest schools.
+ Syracuse City School District: The highest-poverty schools get 12 percent less per pupil on average than the district’s wealthiest schools.
+ Yonkers City School District: The highest-poverty schools get 14 percent less per pupil on average than the district’s wealthiest schools.
| School District | Students Enrolled in Highest-Poverty Schools Below Spending Average | Total Student Enrollment in Highest-Poverty Schools | Percentage of Highest-Poverty Students Below District Spending Average |
| Buffalo | 6,904 | 7,785 | 89% |
| NYC | 35,153 | 139,213 | 25% |
| Rochester | 1,801 | 4,067 | 44% |
| Syracuse | 516 | 3,471 | 15% |
| Yonkers | 3,064 | 6,099 | 50% |
This is the first in a series of reports examining school-level spending by the Rockefeller Institute.
NOTES
[1] “2016 Public Elementary-Secondary Education Finance Data,” Summary Tables, Tab 8, U.S. Census Bureau, last revised May 17, 2018, https://www.census.gov/data/tables/2016/econ/school-finances/secondary-education-finance.html
[2] Ibid, Table 2. The General Brown School District has the lowest average spending per pupil in New York State. Still, the district spends more than 6.8 percent more than the national average. (Using the latest Census data, the General Brown School District spends $12,562 per student versus the US average of $11,762.)
[3] The balance goes to “average need” districts. See: Jim Malatras, Young Joo Park, and Urska Klancnik, Does Education Aid Flow to the Schools that Need it the Most? Low-Performing Schools and the Need for Better Local Spending Data, and the Promise of the Every Student Succeeds Act (Albany: Rockefeller Institute of Government, February 15, 2018), http://rockinst.org/wp-content/uploads/2018/02/2018-02-15_SchoolAidBriefFINAL.pdf, Table 3.
[4] Ibid, Table 4.
[5] See Every Student Succeeds Act State and Local Report Cards Non-Regulatory Guidance, Appendix B: Per-Pupil Expenditures Example — All Expenditures Reported at the School Level (Washington, DC: U.S. Department of Education, January 2017), https://www2.ed.gov/policy/elsec/leg/essa/essastatereportcard.pdf
[6] See Education Law §3614, adopted from Chapter 59 of the Laws of 2018.
[7] See “New York State School Funding Transparency Form,” NYS Division of the Budget, accessed September 24, 2018, https://www.budget.ny.gov/schoolFunding/index.html
[8] We analyzed the data from the following sources: New York City: “New York State School Funding Transparency Forms,” NYC Department of Education InfoHub, accessed September 24, 2018, https://infohub.nyced.org/reports-and-policies/financial-reports/financial-data-and-reports/new-york-state-school-funding-transparency-forms; Rochester: “Part A – District-Level Information,” accessed September 24, 2018, https://www.rcsdk12.org/cms/lib/NY01001156/Centricity/Domain/92/NYS%20School%20Funding%20Form-RCSD.pdf; Buffalo: “NYS School Budget Transparency Form: Related Files,” Buffalo Public Schools, accessed September 24, 2018, https://www.buffaloschools.org/Page/86504; Syracuse: “2018-19 Budget Information,” Syracuse City School District, accessed September 24, 2018, http://www.syracusecityschools.com/districtpage.cfm?pageid=9523; and Yonkers: “Part A – District-Level Information,” accessed September 24, 2018, https://www.yonkerspublicschools.org/cms/lib/NY01814060/Centricity/Domain/72/NYSSchool-Funding-Transparency-Form-2018.pdf
Jim Malatras is President of the Rockfeller Institute of Government