President Joe Biden signed the American Rescue Plan Act (ARP Act) into law on March 11, 2021. The $1.9 trillion spending package is designed to support the distribution of vaccines and accelerate the post-COVID-19 economic recovery. The ARP Act is the sixth federal relief package through which the federal government has allocated a total of $5.7 trillion to directly address the COVID-19 pandemic and related economic fallout. The ARP Act includes $350 billion in funding for state and local governments—the largest allocation to localities to date. This post provides an overview of the state and local aid included in the ARP Act and introduces a series of interactive visualizations that allow users to explore where the funding will be going.
COVID-19 Relief Spending Packages
| Bill | Date | Funding |
| Coronavirus Preparedness and Response Supplemental Appropriations Act, 2020 (Public Law 116-123) | March 6, 2020 | $8.3 billion |
| Families First Coronavirus Response Act (Public Law 116-127) | March 18, 2020 | $192 billion |
| Coronavirus Aid, Relief, and Economic Security Act (CARES Act) (Public Law 116-136) | March 27, 2020 | $2.2 trillion |
| Paycheck Protection Program and Health Care Enhancement Act (Public Law 116-139) | April 24, 2020 | $484 billion |
| Consolidated Appropriations Act (Public Law 116-260) | December 27, 2020 | Omnibus spending bill with $900 billion stimulus relief |
| American Rescue Plan Act (Public Law 117-2) | March 11, 2021 | $1.9 trillion |
State and Local Aid to Date
At the onset of the COVID-19 pandemic, state and municipal governments were facing uncertainty on two fronts. State and local health departments were charged with mounting the public health response, driving increased expenditures associated with establishing testing, contact tracing, treatment, and emergency services. Simultaneously there were concerns about significant revenue shortfalls. High levels of unemployment were expected to result in declines in income tax revenues and reduced economic activity drove down sales tax revenues.
Over the past year, governors and municipal leaders have issued multiple bipartisan calls for federal assistance. The CARES Act in late March 2020 allocated $150 billion to states, local governments, US territories, and tribal governments through the Coronavirus Relief Fund. The funding was limited to finance expenditures incurred in 2020 while addressing the public health emergency. Each state received a minimum of $1.25 billion and the amount was scaled up based on population. This funding could not be used to offset lost tax revenues or other non-health related expenses.
Why State and Local Recovery Matters
State and local governments play a critical role in their local economies. Prior to the pandemic, these governments employed 13.1 percent of the nonfarm labor force (2019) and generated 8.5 percent of the US economy’s output (GDP). Employment at the state and local level declined as steeply as the private sector. While private sector employment reached its lowest levels in April, state and local workers continued to experience furloughs through summer 2020.
Employment Changes During the COVID-19 Pandemic
Baseline = January 2020
Source: Employment Situation Summary, Bureau of Labor Statistics
One of the important lessons learned from the Great Recession recovery is that state and local governments are critical drivers for their regional economies. Many states experienced a fiscal crisis following the Great Recession as they saw multi-year declines in income taxes. Localities which relied on property taxes saw revenues fall as property values collapsed.
State and local governments are fiscally constrained because they must balance budgets annually; declining revenues mean drops in local spending. The federal government, on the other hand, has the flexibility of deficit spending which gives it the power to address state and local budgetary shortfalls in an emergency. Between 2009 and 2012, 30 to 40 percent of state and local governments furloughed or laid off workers, eliminating 574,000 jobs. Cuts hit education, health, and social services—areas that traditionally see a surge in demand in economic crises. Capital investments made at the state and local level were curtailed in response to the fiscal shortfalls, resulting in less spending in the local economy and further declines in revenue and employment for local businesses. At the time, the federal fiscal response was $145 billion in the American Recovery and Reinvestment Act of 2009 (ARRA) to help states fill their budget gaps.
State and local governments cut back spending and investment, further depressing the economy, and government job losses extended the job market recovery. Economists have found these declines in government spending lengthened the recovery compared with other downturns.
Direct State and Local Relief in the ARP Act
The ARP Act designates $350 billion for the Coronavirus State and Local Fiscal Recovery Funds. The House Oversight committee has published preliminary estimates of this funding’s distribution. The funding will flow to states, counties, and individual municipalities, but the ARP Act explicitly prohibits the use of these funds for pensions or tax cuts. (This prohibition on tax cuts may, however, be challenged in court by states’ attorneys general as being unconstitutional.) Identified allowable usages have so far included, but are not limited to:
- addressing the COVID-19 emergency and its negative impacts;
- assistance to households, businesses, non-profits and impacted industries;
- restoring government services that were reduced in response to revenue losses;
- investments in water, sewer, or broadband infrastructure;
- support for public transit; and
- offering premium pay to first responders and essential workers or grants for workers.
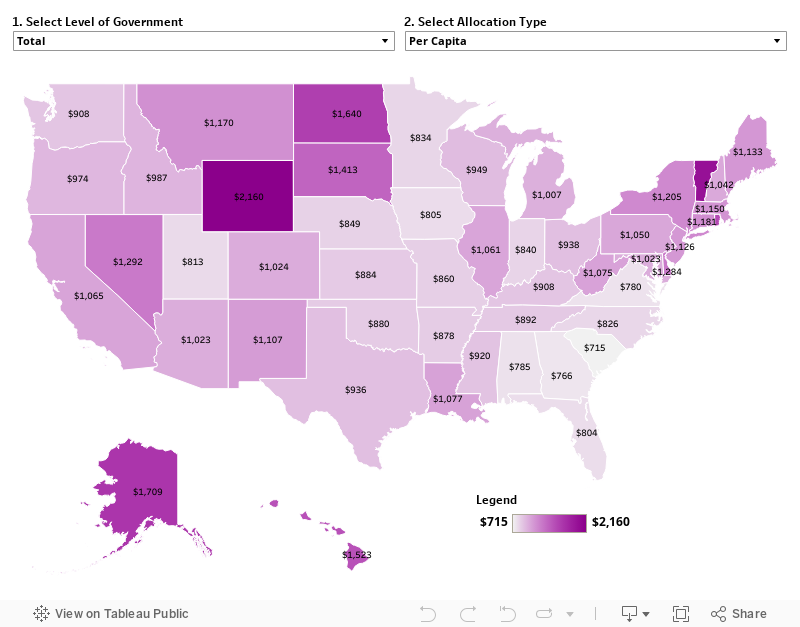
The visualization below shows funding to each of the states in the form of payments to the state, county, city and municipal governments. California, Texas, New York, and Florida are expected to receive the largest total amounts of state and local funding. Data is presented on a per capita basis to adjust for population. On average, the funds deliver $980 per resident, with Wyoming, Vermont, and Alaska projected to receive the most per resident. States in the Northeast and upper Midwest are receiving higher than average per capita funding. States in the southeast and lower Midwest appear to be getting lower than average.
Distribution of Direct State and Local Fiscal Recovery Funds in the ARP Act
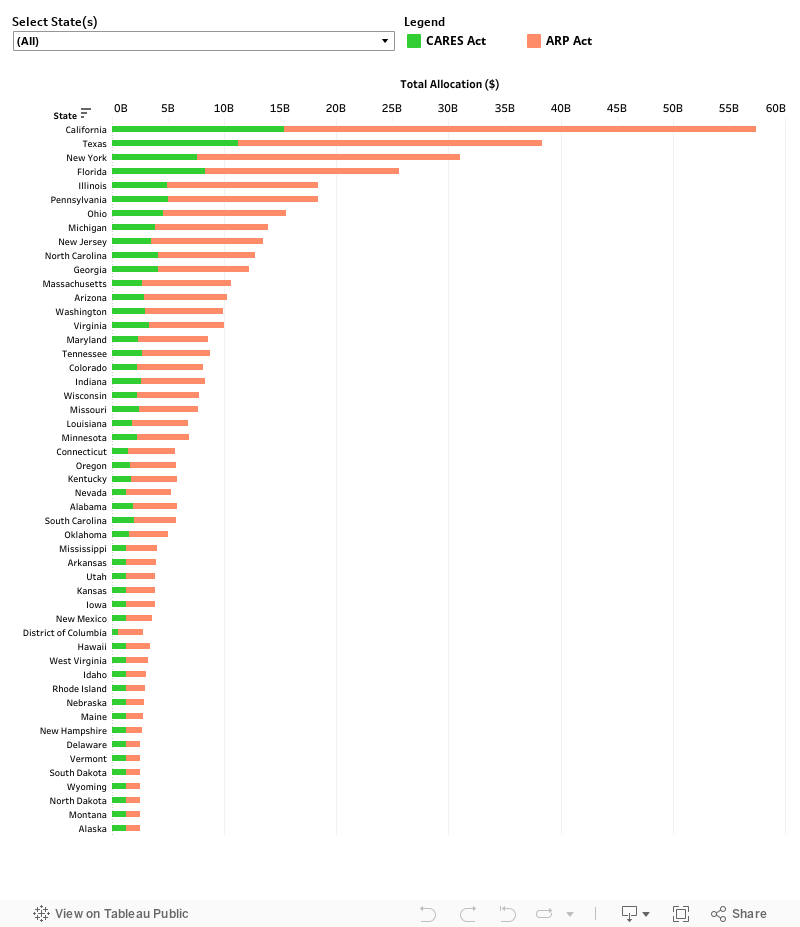
The CARES Act allocated $150 billion to state and local governments and the ARP Act allocated an additional $350 billion. The data visualization below shows how the relief was distributed to the states in the two packages. On average, states received 233 percent more funding from the APR Act as compared to the CARES Act. New York saw its funding triple, experiencing one of the highest increases of any state. These differences in distribution between the two relief packages are due to the fact that the CARES Act funding was allocated by population, while the ARP Act funding will be distributed based on the Community Development and Block Grant formula.
State and Local Funding in the CARES and ARP Acts
On average, 60 cents of every dollar will be delivered to state governments, 20 will go to county governments and the remainder will be delivered to city, town, and village governments.
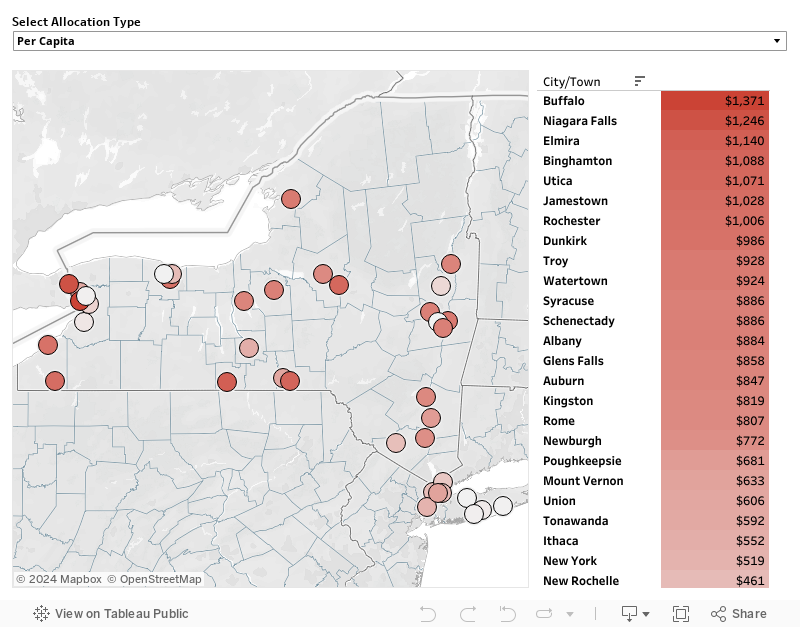
Based on House Oversight Committee estimates, the ARP Act’s Coronavirus Local Fiscal Recovery Funds will be distributed to 39 metro cities[1] in New York. New York City will receive $4.3 billion. The next largest allocations are to Buffalo ($350 million), Rochester ($207 million) and Syracuse ($126 million). Buffalo and Niagara Falls are expected to receive the largest per capita allocations.
ARP Act Funding to New York State Metro Cities
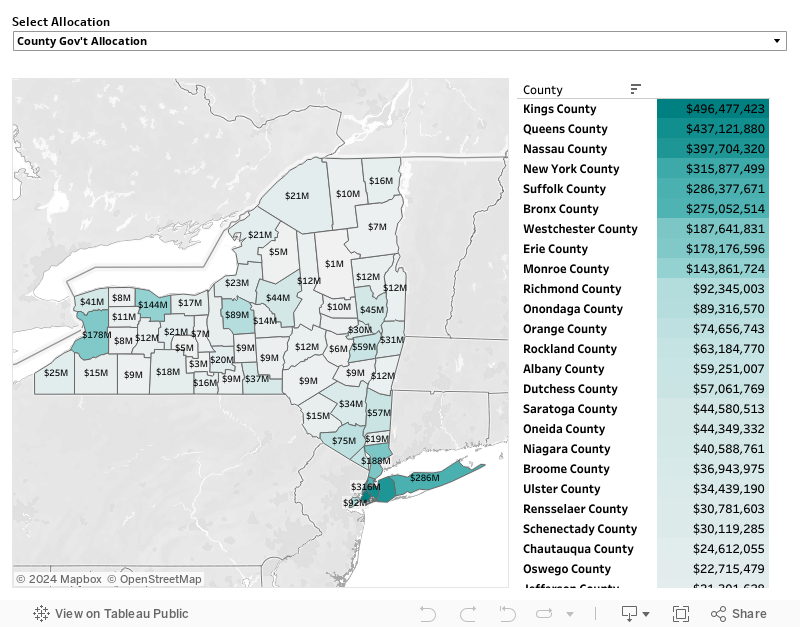
The final visualization explores all of the funding delivered to the different governments within New York State counties. The preliminary ARP Act funding estimates break down recipients into three categories.
- County Governments: funds allocated to county governments based on population.
- Metro Cities: the total funds allocated to all of the metro cities within county borders.
- Other Non-Counties: smaller cities, towns and villages within the county receiving a direct allocation as a metro city.
The ARP Act funding by county presents total funds received by municipalities within each of the counties.[2]
ARP Act Funding by County
Additional Funding
Beyond the $350 billion in direct funding to states and municipalities, the ARP Act allocated funds that could provide additional fiscal support to state and local governments and offset costs incurred in addressing COVID-19 treatment, vaccination efforts, and school reopening. These funds will be distributed by the Department of the Treasury or other relevant agencies to local school districts, public higher education institutions, public transit systems, and state and local health departments. Below are some of the provisions in the ARP that will also directly or indirect support state and local governments.
- Coronavirus Capital Project Funds. $10 billion for states to invest in COVID-19 related projects designed to enable work, education, and health monitoring with additional funding provided for rural communities. Each state will receive $100 million and an additional allocation based on population, rural population, and number of low-income individuals.
- Vaccine Distribution. $7.5 billion distributed by the Centers for Disease Control to support state, local, and tribal public health departments and community health centers for vaccine distribution.
- Funding for Testing Public Health and Support Resources. $47.8 billion distributed from US Health and Human Services (HHS) to support state and local health departments in COVID-19 testing, PPE distribution, contact tracing, and sustaining public health workforce.
- Elementary & Secondary School Emergency Relief Fund. $123 billion in emergency funds to support the reopening K-12 schools.
- Higher Education Emergency Relief Fund. $40 billion to non-profit higher education institutions that will support public universities and community colleges.
- Child Care Development Block Grant Funds. $39 billion in emergency funds in Child Care Development block grant funds. $15 billion through regular program, $24 billion will be grants for child care providers. Child Care Entitlement to States will receive a permanent annual increase.
- Transit Relief Funding. $30 billion for public transit relief to cover lost revenue and prevent layoffs and cuts to transit services.
- Relief of Airports. $8 billion for airports, to cover lost revenues and increased COVID-19 related expenses.
- Expanded Supplemental Nutrition Assistance Program. Extends a 15 percent benefit increase and allocates $1.1 billion for state Supplemental Nutrition Assistance Program (SNAP) administration.
- Federal Medical Assistance Percentage Enhancements. 100 percent coverage for COVID-19 treatment for uninsured without cost sharing, incentives to expand coverage for mental health and substance abuse disorders, an increase of 7.35 percentage points for states who improve Medicaid home and community-based services for one year.
Conclusion
After a year of fiscal uncertainty, state and local governments are receiving resources that will allow them to close budget gaps that developed during the COVID-19 pandemic and restore services that were lost as a result of austerity measures. In addition, the funding will allow leaders at the state and municipal levels to roll out public health measures required to diagnose, treat, and prevent COVID-19 in their communities and vaccinate citizens. The ARP Act funding will also allow leaders to develop initiatives to stimulate economic recovery at the local level by targeting the individuals, businesses, and organizations most in need.
ABOUT THE AUTHOR
Laura Schultz is executive director of research at the Rockefeller Institute of Government
[1] According to the Department of Housing and Urban Development Community Development and Block Grant program: Metropolitan cities are principal cities of Metropolitan Areas (MAs) or other cities within MAs that have populations of at least 50,000.
[2] New York City Funding was distributed to the five counties based on share of the total city population.