
The Rockefeller Institute of Government has updated the Gun Violence in the United States dashboard, an interactive tool that displays nationwide and state-level trends on gun violence over the past twenty years (1999-2019). Using data from the Centers for Disease Control and Prevention’s Underlying Cause of Death database, the dashboard presents data on the total number of all gun deaths, gun homicides, and gun suicides by state, as well as age-adjusted, population-based mortality rates for those key measures. Featuring maps and charts, the dashboard illustrates how the gun violence epidemic has moved through different regions of the country. The dashboard includes data from 2019, the most recent year for which data was released by the CDC. Given the events of the past year, it is likely that 2019 will be an important benchmark. With the COVID-19 pandemic and reported increases in firearm violence across the nation, data for the year 2020 will likely look much different than most years. It is therefore important to recognize the pre-existing trends so that researchers and policymakers can better understand the changes we will see in the forthcoming 2020 data.
This post highlights five key takeaways from the 2019 data.
1. United States Annual Gun Deaths, 1999-2019
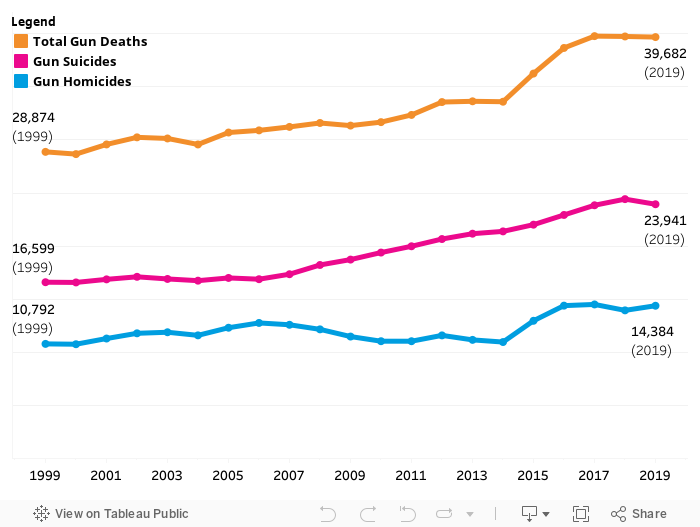
Gun violence now kills more Americans every year than car accidents, which killed over 35,000 people in 2018, according to the World Health Organization. Annual gun deaths in the United States have increased 37 percent, from 28,874 in 1999 to 39,682 in 2019. In 2019, gun violence killed 109 people every day. Over the same period, gun suicides and gun homicides in the US have risen 44 percent (from 16,599 to 23,941) and 33 percent (from 10,792 to 14,384) respectively. In addition to this rising violence, the composition of how people are dying from guns has somewhat shifted. Most recently in 2019, gun suicides accounted for 60 percent of the 39,682 gun deaths in the United States whereas gun homicides made up 36 percent. In 1999, gun homicides represented a larger share of violence in the country at 41 percent of all gun deaths; suicides represented 57 percent of gun violence. While gun homicides and suicides make up about 96 percent of total gun violence, the CDC also tracks gun accidents, legal interventions, and incidents of undetermined intent, which account for the remaining 4 percent in 2019.
2. Total Gun Deaths per 100,000 by State
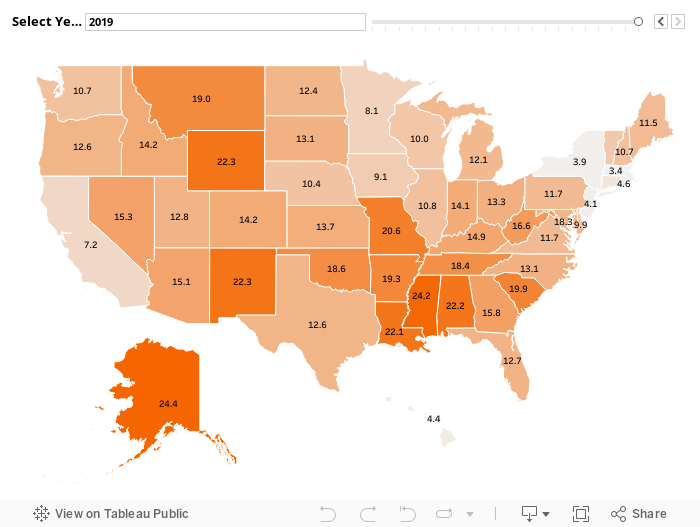
In 2019, five of the six states with the fewest gun deaths per 100,000 residents were Connecticut, Massachusetts, New Jersey, New York, and Rhode Island. These Northeastern states all participate in the Regional Gun Violence Research Consortium. They have remained at the bottom of the list for some time: twenty years prior, the same five states occupied five of the seven lowest gun death rates in the nation. In each of the twenty years’ worth of available data none of these states was ever below seventh, showing the consistently low gun death rates in this region. In both of the years that bookend the data, Massachusetts had the lowest gun death rate: 3.4 deaths per 100,000 residents in 2019 and 3.0 in 1999, compared to the overall US rate of 11.9 and 10.3 respectively. These states have some of the strongest gun laws in the nation.
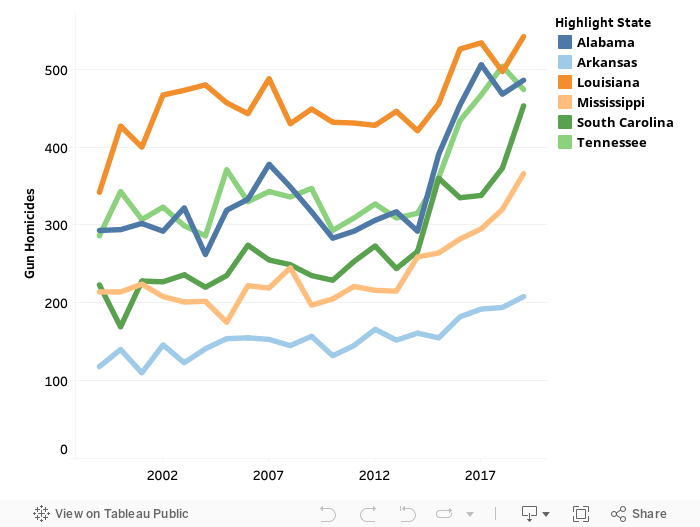
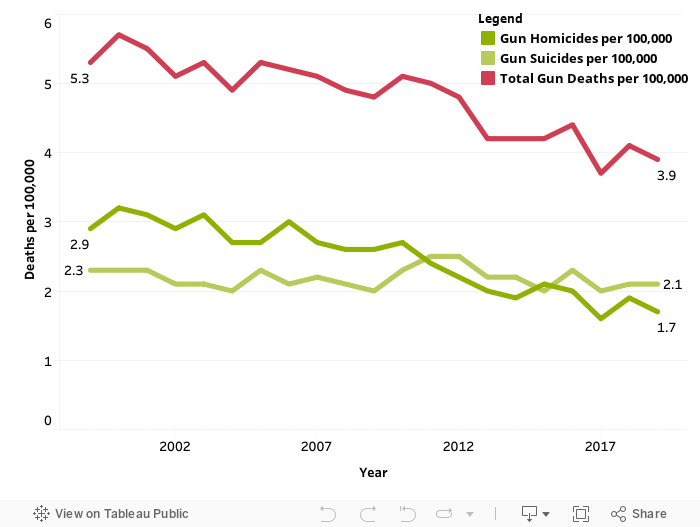
3a. Gun Homicides in Selected States, 1999-2019
3b. Gun Homicides per 100,000 by State
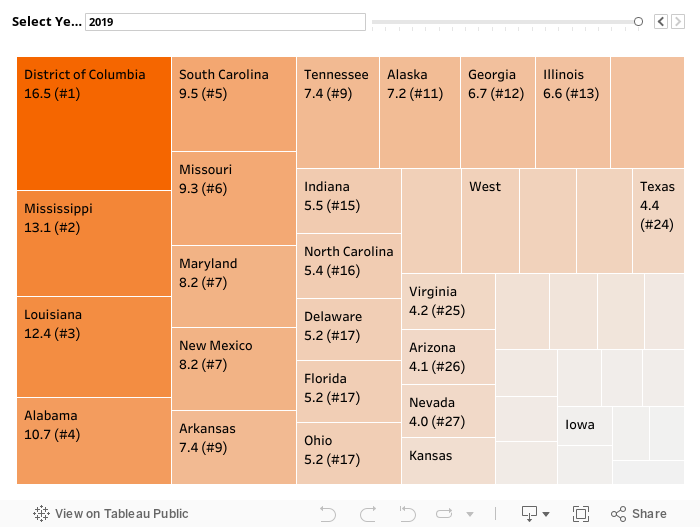
In 2019, six of the ten highest gun homicide rates in the country belonged to states in the South (Mississippi, Louisiana, Alabama, South Carolina, Tennessee, and Arkansas), including three of the top four. While total gun homicides are higher in populous states like Texas, California, and Florida, some of the most troubling gun homicide rates per 100,000 residents are in the Southeastern US. In 2019, Mississippi reported 13.1 gun homicides per 100,000 residents, which is more than double the national rate of just 5.3. Of these six states, only Tennessee saw a decline in gun homicides from 2018 to 2019. Over the past twenty years (1999-2019), gun homicides in these states alone have risen 71 percent, compared to only 33 percent nationwide. These six states have some of the weakest gun laws in the nation.
4. Gun Suicides per 100,000 by State
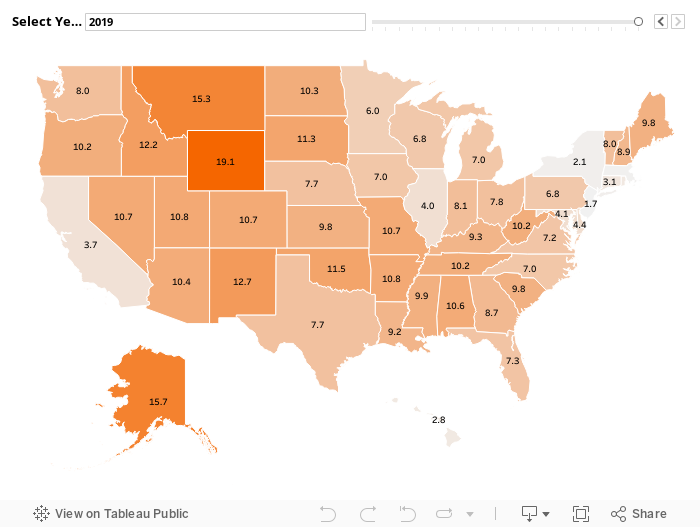
All five of the highest gun suicide rates in the nation for 2019 were in the West (Wyoming, Alaska, Montana, New Mexico, and Idaho), ranging from 12 to 19 gun suicides per 100,000 residents. For context, the US overall rate for gun suicides per 100,000 residents was 6.8 in 2019. Decades ago in 1999, the top five were also all Western states, with Nevada moving into the top five, and Idaho falling into the sixth-highest gun suicide rate that year. In 1999, the US overall rate for gun suicides per 100,000 was 6.0, showing that these states far exceed the national rate and have for years.
5. Gun Violence in New York, 1999-2019
Gun violence in the state of New York has decreased across the board over the past two decades (1999-2019). During that time, gun deaths in the state have dropped 21 percent (from 1,106 to 804). In addition, the total gun death rate, gun suicide rate, and gun homicide rate have all fallen since the CDC began the Underlying Cause of Death database in 1999. Controlling for suppressed data, New York was among the top 5 in fewest gun deaths by population, gun suicides by population, and gun homicides by population in 2019, a designation only shared by Massachusetts.
A special thank you to Joe Popcun, executive director of the Regional Gun Violence Research Consortium; Leigh Wedenoja, senior policy analyst at the Rockefeller Institute; and Joel Tirado, communications media specialist at the Rockefeller Institute for their help with this project.
ABOUT THE AUTHOR
Nicholas Simons is project coordinator at the Rockefeller Institute of Government and helps lead the Regional Gun Violence Research Consortium.