
More than two years into the pandemic the United States has passed the tragic threshold of 1 million deaths due to COVID-19. We have reached this terrible milestone still working to understand both how the virus functions from a medical and scientific perspective and how the pandemic has affected and will continue to affect our lives, communities, and economy in a broader sense. Looking back to the first year of the pandemic and the detailed data on COVID-19 deaths now available for that year can provide valuable insight as we move forward.
In 2020 alone, the Centers for Disease Control and Prevention (CDC) reported 350,831 deaths in which COVID-19 was the underlying cause of death listed on the death certificate; of those deaths, 19,413 occurred in the decedent’s home. Throughout the COVID-19 pandemic, public health practitioners and researchers have focused heavily on the role that hospitals and hospital capacity plays in who dies or has serious complications from COVID-19 but substantially less attention has been paid to people who die at home without seeking medical care. In some cases, dying at home is a conscious choice; people have chosen to die at home for the increased comfort that it affords over being hooked up to machines in the hospital. Other COVID-19 deaths in the home may be driven by external factors, including a lack of access to medical care due to distance, lack of capacity in hospitals, a lack of health insurance, or postponing seeking care until it is too late.
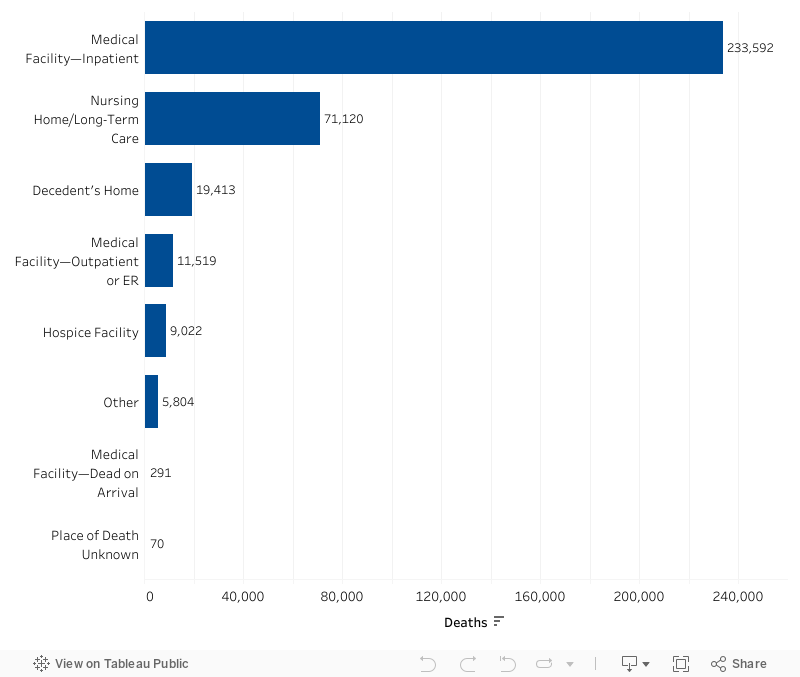
Data for this research are generated from death certificates contained in the Mortality Multiple Cause Files and in CDC Wonder. Death certificates document and categorize one of seven places of death: hospital (in-patient, outpatient, or dead-on arrival), nursing home, hospice, decedent’s home, or other place. They also include the demographic characteristics of decedents and the cause or causes of death. The goal of this analysis is to document and understand the association between place of death and characteristics of people who died of COVID-19. We examine differences by age, race, state, month, and whether the county of the decedent is urban/suburban or rural.
Figure 1. COVID-19 Deaths by Place
A Large Share of Young Adults Died at Home from COVID-19 in 2020
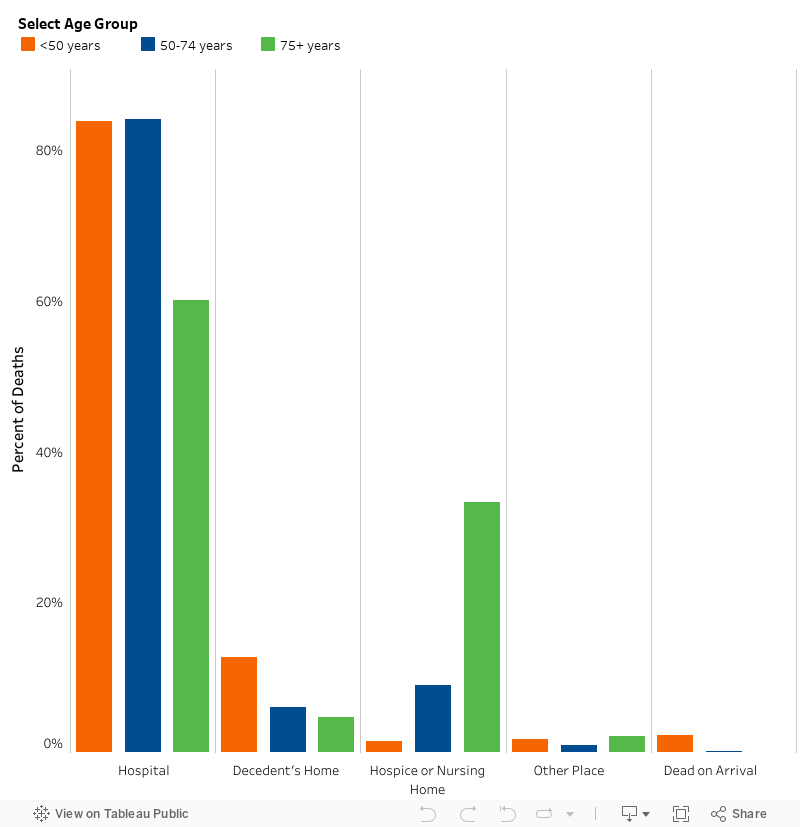
The risk of dying from COVID-19 increases substantially with age. The mortality rate for the disease was 893.8 deaths per 100,000 people among those 75 years and older, which was over six times higher than the rate for persons 50-74 years old (135.0) and over 120 times higher than the rate for persons under 50 years old (7.4). Although older individuals are much more likely to die from COVID-19, younger individuals are more likely to die at home from the disease. Our analysis found that more than one in eight (12.7 percent) adults younger than 50 years old who died from COVID-19 died at home. By comparison, only 6 percent of adults aged 50-74 years old and 4.7 percent of adults 75 years and older died at home. One potential explanation for the high percentage of young adults dying at home is that they did not take COVID-19 seriously. Many may have also foregone medical treatment for the disease because they underestimated the lethality of the virus and overestimated their ability to ward off serious illness or were initially reassured by doctors that they were low-risk and did not seek additional care as a result.
Figure 2. Place of COVID-19 Deaths by Age Group, 2020
It is also possible that some young adults avoided seeking medical help because they did not have health insurance. The Census Bureau estimates that over 15 percent of people 19-34 years old are uninsured. The (HRSA) COVID-19 Uninsured Program reimburses providers for the cost of treating uninsured people with COVID-19, but many people are unaware that the government would cover the cost of their treatment. For example, a 30-year-old man who was admitted to the hospital with COVID-19 in July 2020 was never told by his doctors about the HRSA program. The man did not have health insurance and he worried about the cost of treatment. His family wondered whether concerns about cost influenced his decision to leave the hospital rather than stay overnight. He died at home from COVID-19 the day after being discharged.
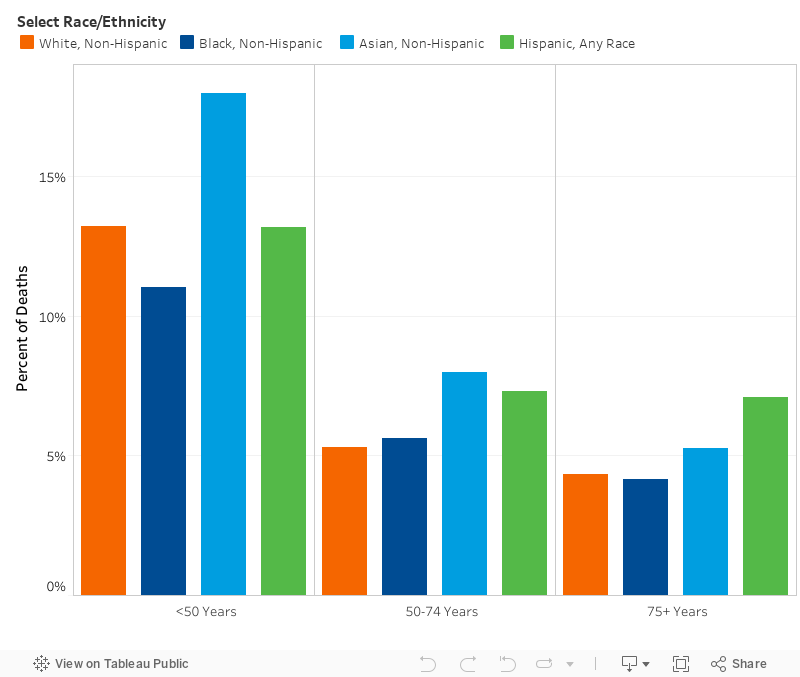
We also observed differences across race and ethnicity in the proportion of young adults who died at home from COVID-19. Nearly a fifth (18 percent) of non-Hispanic Asian people under 50 years old died at home, a higher share than for non-Hispanic white people (13.2 percent), Hispanic people (any race) (13.1 percent), and non-Hispanic Black people (11.0 percent). The analysis of place of death for people under 50 years old also showed that a higher percentage of Black people (85.6 percent) and Hispanic people (84.4 percent) died in hospitals from COVID-19 than white people (80.7 percent) and Asian people (78.3 percent). Our findings are consistent with a report from the CDC showing that Black people and Hispanic people are overall about twice as likely to be hospitalized for COVID-19 as white people. That report also found that Asian people are 20 percent less likely to be hospitalized than white people.
Figure 3. Place of COVID-19 Deaths by Race and Ethnicity, 2020
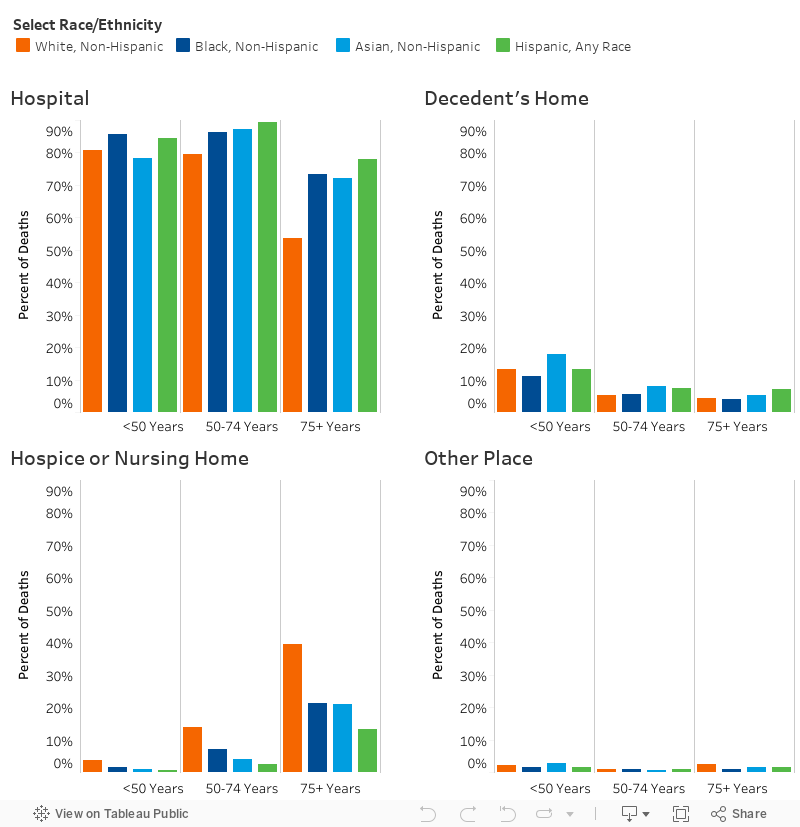
Figure 4. Home Deaths by Race/Ethnicity
Comorbidities for Decedents of COVID-19 Differ by Place of Death
Certain comorbidities increase the risk of serious illness or death from COVID-19. People with lung diseases, such as chronic obstructive pulmonary disease (COPD), are particularly susceptible to severe illness because COVID-19 can cause additional complications of the lungs, including pneumonia and acute respiratory distress syndrome. Obesity, diabetes, and hypertension can also lead to more severe illness from COVID-19. For example, the physiological effects of obesity can include a reduction in respiratory capacity and a weakening of the immune system, making the body less prepared to combat a viral infection. Our analysis compared the comorbidities listed on death certificates by place of death for decedents of COVID-19.[1]
The data showed that COVID-19 was the only cause of death listed on 21,432 (6.1 percent) of the 350,831 certificates in which COVID-19 was the underlying cause of death. The remaining 329,419 certificates (93.9 percent) contained at least one comorbidity and up to 13 contributing comorbidities. Over 1 in 10 (10.9 percent) of people who died at home had no additional comorbidities. That number was 1 in 20 for people who died in the hospital. Further, people who died at home had, on average, a smaller number of comorbidities (2.4) than people who died in the hospital (3.1), hospice (2.8), or a nursing home (2.5).
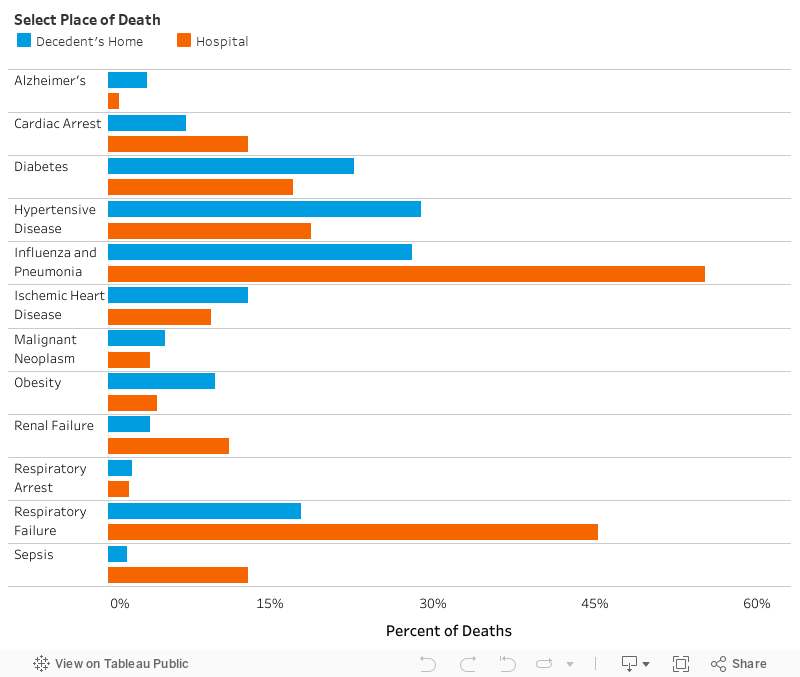
In addition, we found that people who died at home from COVID-19 were more likely than people who died in the hospital to have hypertensive disease (29.0 percent versus 18.8 percent), diabetes (22.7 percent versus 17.1 percent), and obesity (9.9 percent versus 4.5 percent) listed on their death certificate. People who died at home, however, were also less likely than people who died in the hospital to have an immediate cause of death listed on their certificate, such as respiratory failure (17.9 percent versus 45.3 percent) or cardiac arrest (7.2 percent versus 12.9 percent). We also observed variation in the share of people who had chronic diseases listed on death certificates by age group. More than a third of people under 50 years old who died at home had a co-occurring diagnosis of obesity (693 of 1,996; 35.3 percent), compared to less than a fifth of those under 50 years old who died in the hospital (2,239 of 13,017; 17.2 percent).
Figure 5. Comorbidities for Decedents of COVID-19 Differ by Place of Death, 2020
Place of Death from COVID-19 was Different in Urban and Rural Counties
The COVID-19 crude mortality rate in 2020 was 129.3 per 100,000 persons in rural counties, compared to 102.8 per 100,000 persons in urban/suburban counties. Much of this difference reflects variations in the characteristics of rural and urban populations. People living in rural counties are generally older, more likely to lack health insurance, and more likely to have a chronic health condition than people living in urban/suburban counties. Rural residents also generally must travel farther to access a hospital, including emergency/intensive care.
We analyzed place of death from COVID-19 using the 2013 National Center for Health Statistics Urban-Rural Classification Scheme. According to this scheme, decedent’s county of residence is labeled as one of six urban-rural categories. Four of the categories are considered urban or suburban (large central metropolitan, large fringe metropolitan, medium metropolitan, and small metropolitan), and two of the categories are considered rural (micropolitan and non-core). The results showed only a marginal difference in the share of at-home deaths between rural (5.3 percent) and urban counties (5.6 percent) in the United States, despite apparent variations in access to health care. Meanwhile, the proportion of people dying in the hospital was smaller in rural areas (62.6 percent) than in urban areas (67.4 percent).
Figure 6. Place of Death in Rural and Urban Communities
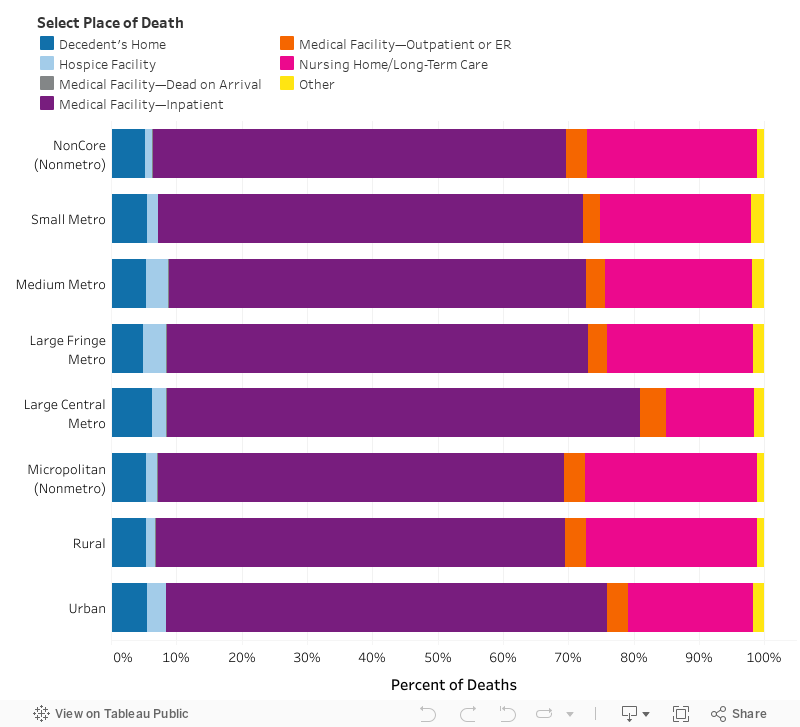
The largest disparity in place of death between rural and urban counties in the United States was in the share of people dying in nursing homes. Our analysis of national data showed that, in 2020, the proportion of people dying from COVID-19 in nursing homes compared to other locations of death was substantially higher in rural areas than urban areas (26.2 percent versus 19.1 percent). Nursing homes in rural areas may have been less equipped than their urban counterparts to manage the spread of the virus, with many severely lacking personal protective equipment or adequate staffing. Further, a spate of hospital closures in rural counties in recent years has meant that residents of nursing homes in those counties have limited access to medical care. Notably, death certificates only show the location where a person was pronounced clinically dead. Our analysis, therefore, does not reflect if a person who died in a hospital had been residing in a nursing home at the time of his or her death.
People in Western States Were Most Likely to Die at Home from COVID-19
There was substantial variation across the United States in COVID-19 mortality in 2020 by Census region. The age-adjusted mortality rate was 113.0 deaths per 100,000 persons in the Northeast, compared to 89.5 in the Midwest, 80.2 in the South, and 64.6 in the West. Differences in mortality by geography were influenced by when the virus was first introduced in each state and by variations in population density. Cases of COVID-19 were initially concentrated in urban areas with high population density, before spreading to rural areas with lower population density. The first wave of the virus (March 2020 to June 2020) was concentrated in New York City and other densely populated parts of the Northeast, leading those areas to employ aggressive public health measures. The brunt of the pandemic shifted to the South in July 2020, where public officials were generally less inclined than their counterparts in the Northeast to institute testing resources and requirements, mask mandates, and other public health measures.
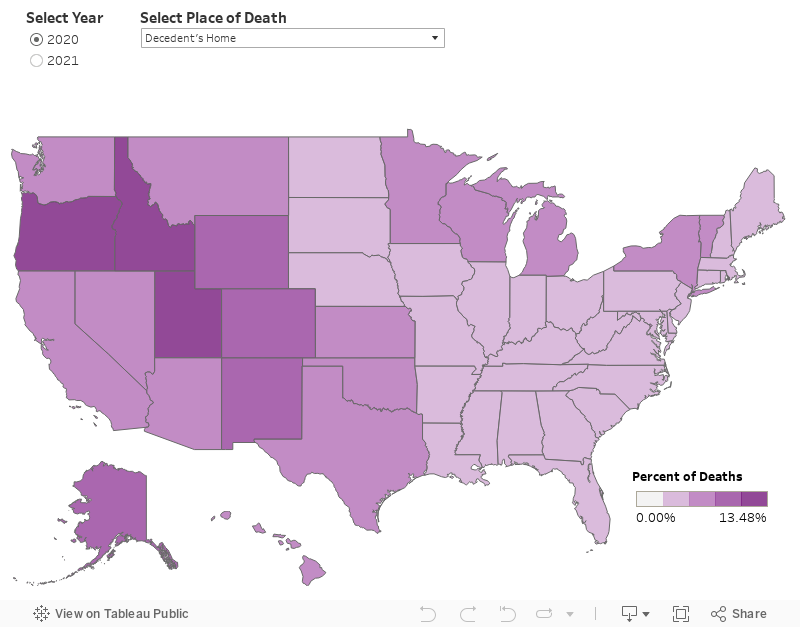
Our analysis aimed to determine how region- and state-level differences might contribute to differences in place of death from COVID-19. The data showed that a larger percentage of people in the West died at home from the virus (7.8 percent) than people in the Midwest (5.2 percent), the South (5.1 percent), and the Northeast (4.8 percent). The states with the highest share of at-home deaths were Utah (13.5 percent), Idaho (12.2 percent), and Oregon (10.9 percent). The states with the smallest percentage of at-home deaths were Massachusetts (2.87 percent), New Hampshire (2.95 percent), and West Virginia (2.96 percent). We found that 17.3 percent of people who died at home in the West were under 55 years old, and 82.7 percent were over 55 years old. In comparison, a much smaller proportion of people who died at home in the Northeast (15.6 percent), the South (14.9 percent), and the Midwest (12.2 percent) were under 55 years old.
Figure 7. Percentage of COVID-19 Deaths by Place of Death, 2020-21
Differences in driving distance to the hospital may have contributed to the geographic variation in place of death from COVID-19. A higher percentage of people who live in the West must drive over 30 minutes to reach the nearest hospital than people who live in other regions, and long travel times to the hospital may dissuade people from seeking medical care. Moreover, data compiled by the Kaiser Family Foundation show that a large share of the population in some Western states live in counties with no intensive care units (ICU). In Idaho, for example, 33 of the 42 counties in the state do not have a hospital with any ICUs, representing 24.1 percent of the total population and 27.9 percent of the population 60 years and older. An ICU may provide better care to patients with severe COVID-19 than a general hospital ward because it can provide more sophisticated equipment and a higher staff-to-patient ratio.
The Share of At-Home Deaths Has Increased, Whereas the Share of Deaths in Nursing Homes Has Decreased
New viral strains of COVID-19 emerged in 2021, including the more contagious omicron and delta variants. Those new variants may have contributed to an increase in the age-adjusted mortality rate from the disease in the United States, which rose from 106.5 deaths per 100,000 persons in 2020 to 126.6 in 2021. At the same time, vaccines to protect against COVID-19 were distributed and newly approved therapeutics, such as monoclonal antibodies, were used to treat patients with the disease. At the close of 2021, over 200 million individuals in the US had been fully vaccinated, accounting for 63.4 percent of the total population. We use provisional mortality data from 2021 to capture how place of death changed for decedents of COVID-19 amidst the shifting nature of the pandemic. The provisional data are incomplete and subject to change; nonetheless, they are useful for identifying trends in mortality.
Our analysis found that the percentage of people dying at home from the coronavirus increased from 5.5 percent in 2020 to 8.0 percent 2021. In comparison, the percentage of influenza-related deaths (ICD J9-J11) that occurred in the home was, on average, 7.7 percent during calendar years 2015 through 2019. The upturn in at-home deaths of COVID-19 between 2020 and 2021 occurred in every state except Alaska. New Hampshire was the state with largest increase in the proportion of at-home deaths, from 3.0 percent in 2020 to 9.5 percent in 2021. This rise between 2020 and 2021 in the share of people dying at home from COVID-19 was largely driven by an increase in the percentage of at-home deaths among persons 65-74 years old (+1.5 percent), 75-84 years old (+2.8 percent), and 85 years and older (+5.9 percent). Meanwhile, there was a decline in the percentage of deaths at home among persons 15-24 years old (-2.2 percent), 25-34 years old (-0.2 percent), and 35-44 years old (-2.4 percent).
Figure 8. Place of COVID-19 Deaths, 2020-22
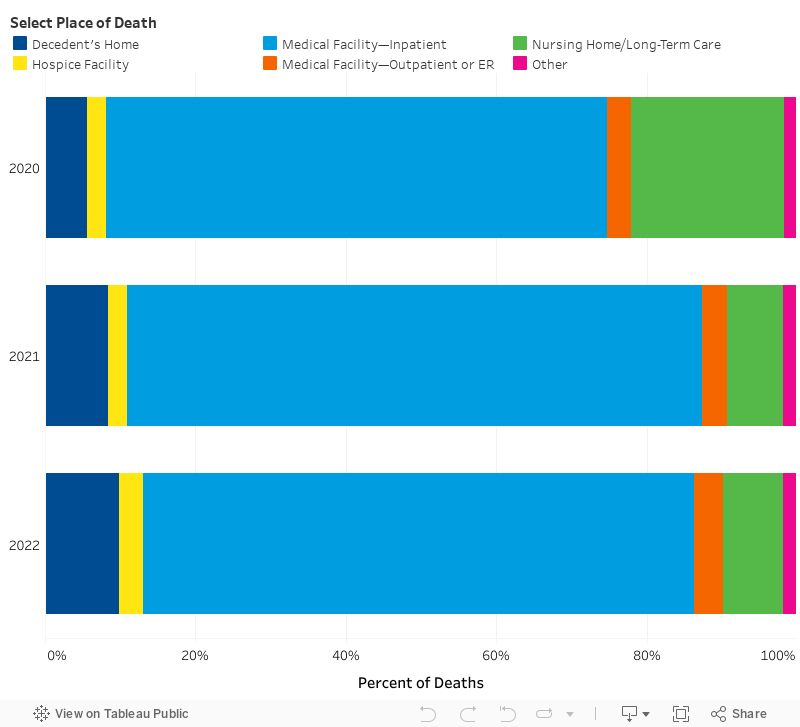
The data also showed that nationally the proportion of deaths from COVID-19 in nursing homes decreased from 20.3 percent in 2020 to 7.5 percent in 2021. The share of deaths in these facilities declined as the high coverage of vaccination among residents and better procedures to control the spread of infection rose. The share of people dying in nursing homes may also have declined because fewer people decided to live in nursing homes in 2021, opting instead for home-based care. Nursing homes experienced a year-over-year increase in vacancies and a decline in admissions. The decision to keep family members out of nursing homes may have been prompted by the inability of many of these facilities to protect residents from COVID-19. Many nursing homes lacked adequate supplies of personal protective equipment and experienced shortages of staff. Congregate living arrangements, in combination with poor infection control, also made residents vulnerable to COVID-19.
Conclusion
Since the data this research is based on was recorded, we have passed 1 million deaths from COVID-19 in the US. In that time, we have learned substantially more about how the virus transmits, the risk factors for serious complications, and how to better protect ourselves with transmission mitigation measures and vaccines. Despite these advances, people continue to die and it is important to stay proactive in the prevention, treatment, and study of COVID-19 to prevent as many of those deaths as possible.
Death certificates show that there were 19,413 deaths from COVID-19 that occurred in the home in 2020, representing over 5 percent of all deaths from the disease. A large share of those people dying at home were young adults. Young adults may have not sought medical care in the hospital for COVID-19 because they underestimated the severity of the disease or because they were concerned about the cost of treatment. Another notable finding was that people who died at home from the disease were more likely to have chronic conditions, such as obesity and diabetes, listed on their death certificate than people who died in the hospital from the disease. There was also substantial variation across the country in place of death, with the highest share of people dying at home from COVID-19 in Western states.
In addition, provisional data indicate that the share of people dying at home from COVID-19 increased between 2020 and 2021. The increase in the proportion of at-home deaths was largest among people 65 years and older. We speculate that some older adults may have forgone nursing home care in favor of home-based care. We also observed a substantial year-over-year decline in the share of young adults dying at home from COVID-19. That decline was potentially attributable to young adults learning more about the need to seek medical treatment for the disease and medical providers becoming more experienced and proactive in their care and advice leading fewer people to try and recover from the illness at home. Concerns about the cost of medical treatment for COVID-19 may have also declined in 2021, as more uninsured people learned that the HRSA uninsured program would cover their cost of care.
Finally, the number of individuals documented as dying at home from COVID-19 in 2020 may have been an undercount. Several major cities reported a huge spike in at-home deaths during the pandemic. New York City, for example, observed an approximately six-fold increase in the number of deaths occurring in residents’ homes during April 2020. Those excess deaths were likely either directly or indirectly linked to COVID-19. The sheer number of deaths and the lack of diagnostic testing, however, limited the ability of officials to definitively ascertain the cause of death. In addition, disambiguating the cause of death in the home can be more difficult than doing so in a medical facility. Coroners may also be more likely than medical examiners to fill out death certificates for individuals who die at home, and these officials, who are generally lay people, may lack the medical training to recognize COVID-19 as being the cause of death of some decedents. Further research is needed to fully understand these “excess deaths” and their relationship with COVID-19.
ABOUT THE AUTHORS
Patrick Schumacher is a graduate research assistant at the Rockefeller Institute of Government.
Leigh Wedenoja is a senior policy analyst at the Rockefeller Institute of Government.
[1] The data that we use from Multiple Mortality Cause Files shows an underlying cause of death for each decedent and up to 20 contributing causes. It is impossible to tell from this data whether the medical examiner input contributing causes in Part I or II of the certificate and in what order. Part I of the certificate shows conditions that directly contributed to death, referred to as chain of event conditions, while Part II shows other significant conditions that contributed to death but did not result in the underlying cause. The original location and order of codes by the certifier, however, may contain repetitive codes and contradictions. The CDC, therefore, uses an algorithm to “clean” the codes to present the most representative and precise description of the cause of death. The algorithm, however, does not retain the original ordering of the codes as belonging in Part I or II of the certificate. For our analysis, we follow the recommendation from the CDC to use the cleaned version of the codes (called record axis codes) for multiple cause of death tabulations.