This is the second in a series on property taxes in New York State by the Rockefeller Institute of Government. Collaborating with other organizations[1], the Rockefeller Institute will take an in-depth look into various issues surrounding property taxes including their impact on local governments, case studies of how the tax cap is working in school districts, the future of education financing and its reliance on local property taxes, and property tax assessments.
As policymakers in Albany debate whether to make the property tax cap permanent, data show that homeowners in every region have received significant property tax savings. That is why Governor Cuomo included provisions to make the tax cap permanent in his proposed Executive Budget and the state Senate overwhelmingly passed a bill to make the property tax cap permanent this January.[3] But the state Assembly — both the Democratic and Republican conferences[4] — has yet to commit to passing this bill and has signaled its desire to use it as a bargaining chip in negotiations over housing regulation legislation, or to first loosen the cap to allow greater tax increases.
 >How does the tax cap work?
In our first piece, we analyzed the effectiveness of the tax cap on reducing school property taxes — taxes that make up nearly 70 percent of a homeowner’s overall local property tax bill on average. We found that the tax cap resulted in dramatic reductions in the average annual school property tax increases — reducing school tax increases from 6.6 percent annually in the pre-Great Recession years to 1.9 percent under the property tax cap.
Regional Property Tax Rate Reductions under the Tax Cap
In this piece, we measure the effectiveness of the tax cap on reducing property taxes in various regions of the state. Using the state’s Regional Economic Development Councils, we found that every region has benefited from the property tax cap.[5] Figure 1 illustrates that school property tax rates have been dramatically cut in every region after the tax cap was put into effect and, using conservative estimates, homeowners have saved at least $16.7 billion on school taxes as a result.
FIGURE 1. Regional School Property Tax Increases, Pre-Great Recession, During the Great Recession, and After the Tax Cap
Source: Rockefeller Institute of Government analysis of New York State Education Department Property Tax Report Card data. To account for the economic downturn during the Great Recession, we separated our analysis into three time periods: (1) pre-Great Recession (2004-07), (2) the Great Recession years (2008-11), and (3) years after the implementation of the property tax cap (2012-18).[6]
Prior to implementation of the tax cap and before the late-aughts economic recession, schools in the Mid-Hudson (7.6 percent) and Long Island (6.8 percent) regions had the largest average annual school property tax increases — about double the rate of inflation.[7] Western New York schools had the lowest (4.0 percent) (see Figure 2).
FIGURE 2. Highest to Lowest Average Regional School Property Tax Increases
Pre-Great Recession (2004-07)
Source: Rockefeller Institute of Government analysis of New York State Education Department Property Tax Report Card data.
After implementation, property tax growth was cut in every region compared to pre-Great Recession years, and in all but one region compared to Great Recession years.[8] In the years following the implementation of the property tax cap, Central New York school districts have the lowest property tax increases, while Western New York school districts have increased taxes the most (see Figure 3). Western New York school districts had the lowest annual property tax increases prior to the Great Recession, however.
FIGURE 3. Highest to Lowest Average Regional School Property Tax Increase
Post-Tax Cap (2012-18)
Source: Rockefeller Institute of Government analysis of New York State Education Department Property Tax Report Card data.
Not only have Central New York school districts had lower overall annual property tax increases under the tax cap, these districts also have cut the property tax rate the most since the Great Recession (see Figure 4). The Mid-Hudson and Long Island regions follow Central New York with the greatest school property tax decreases during this period.
FIGURE 4. Largest Regional School Property Tax Rate Decrease from pre-Great Recession to After Tax Cap
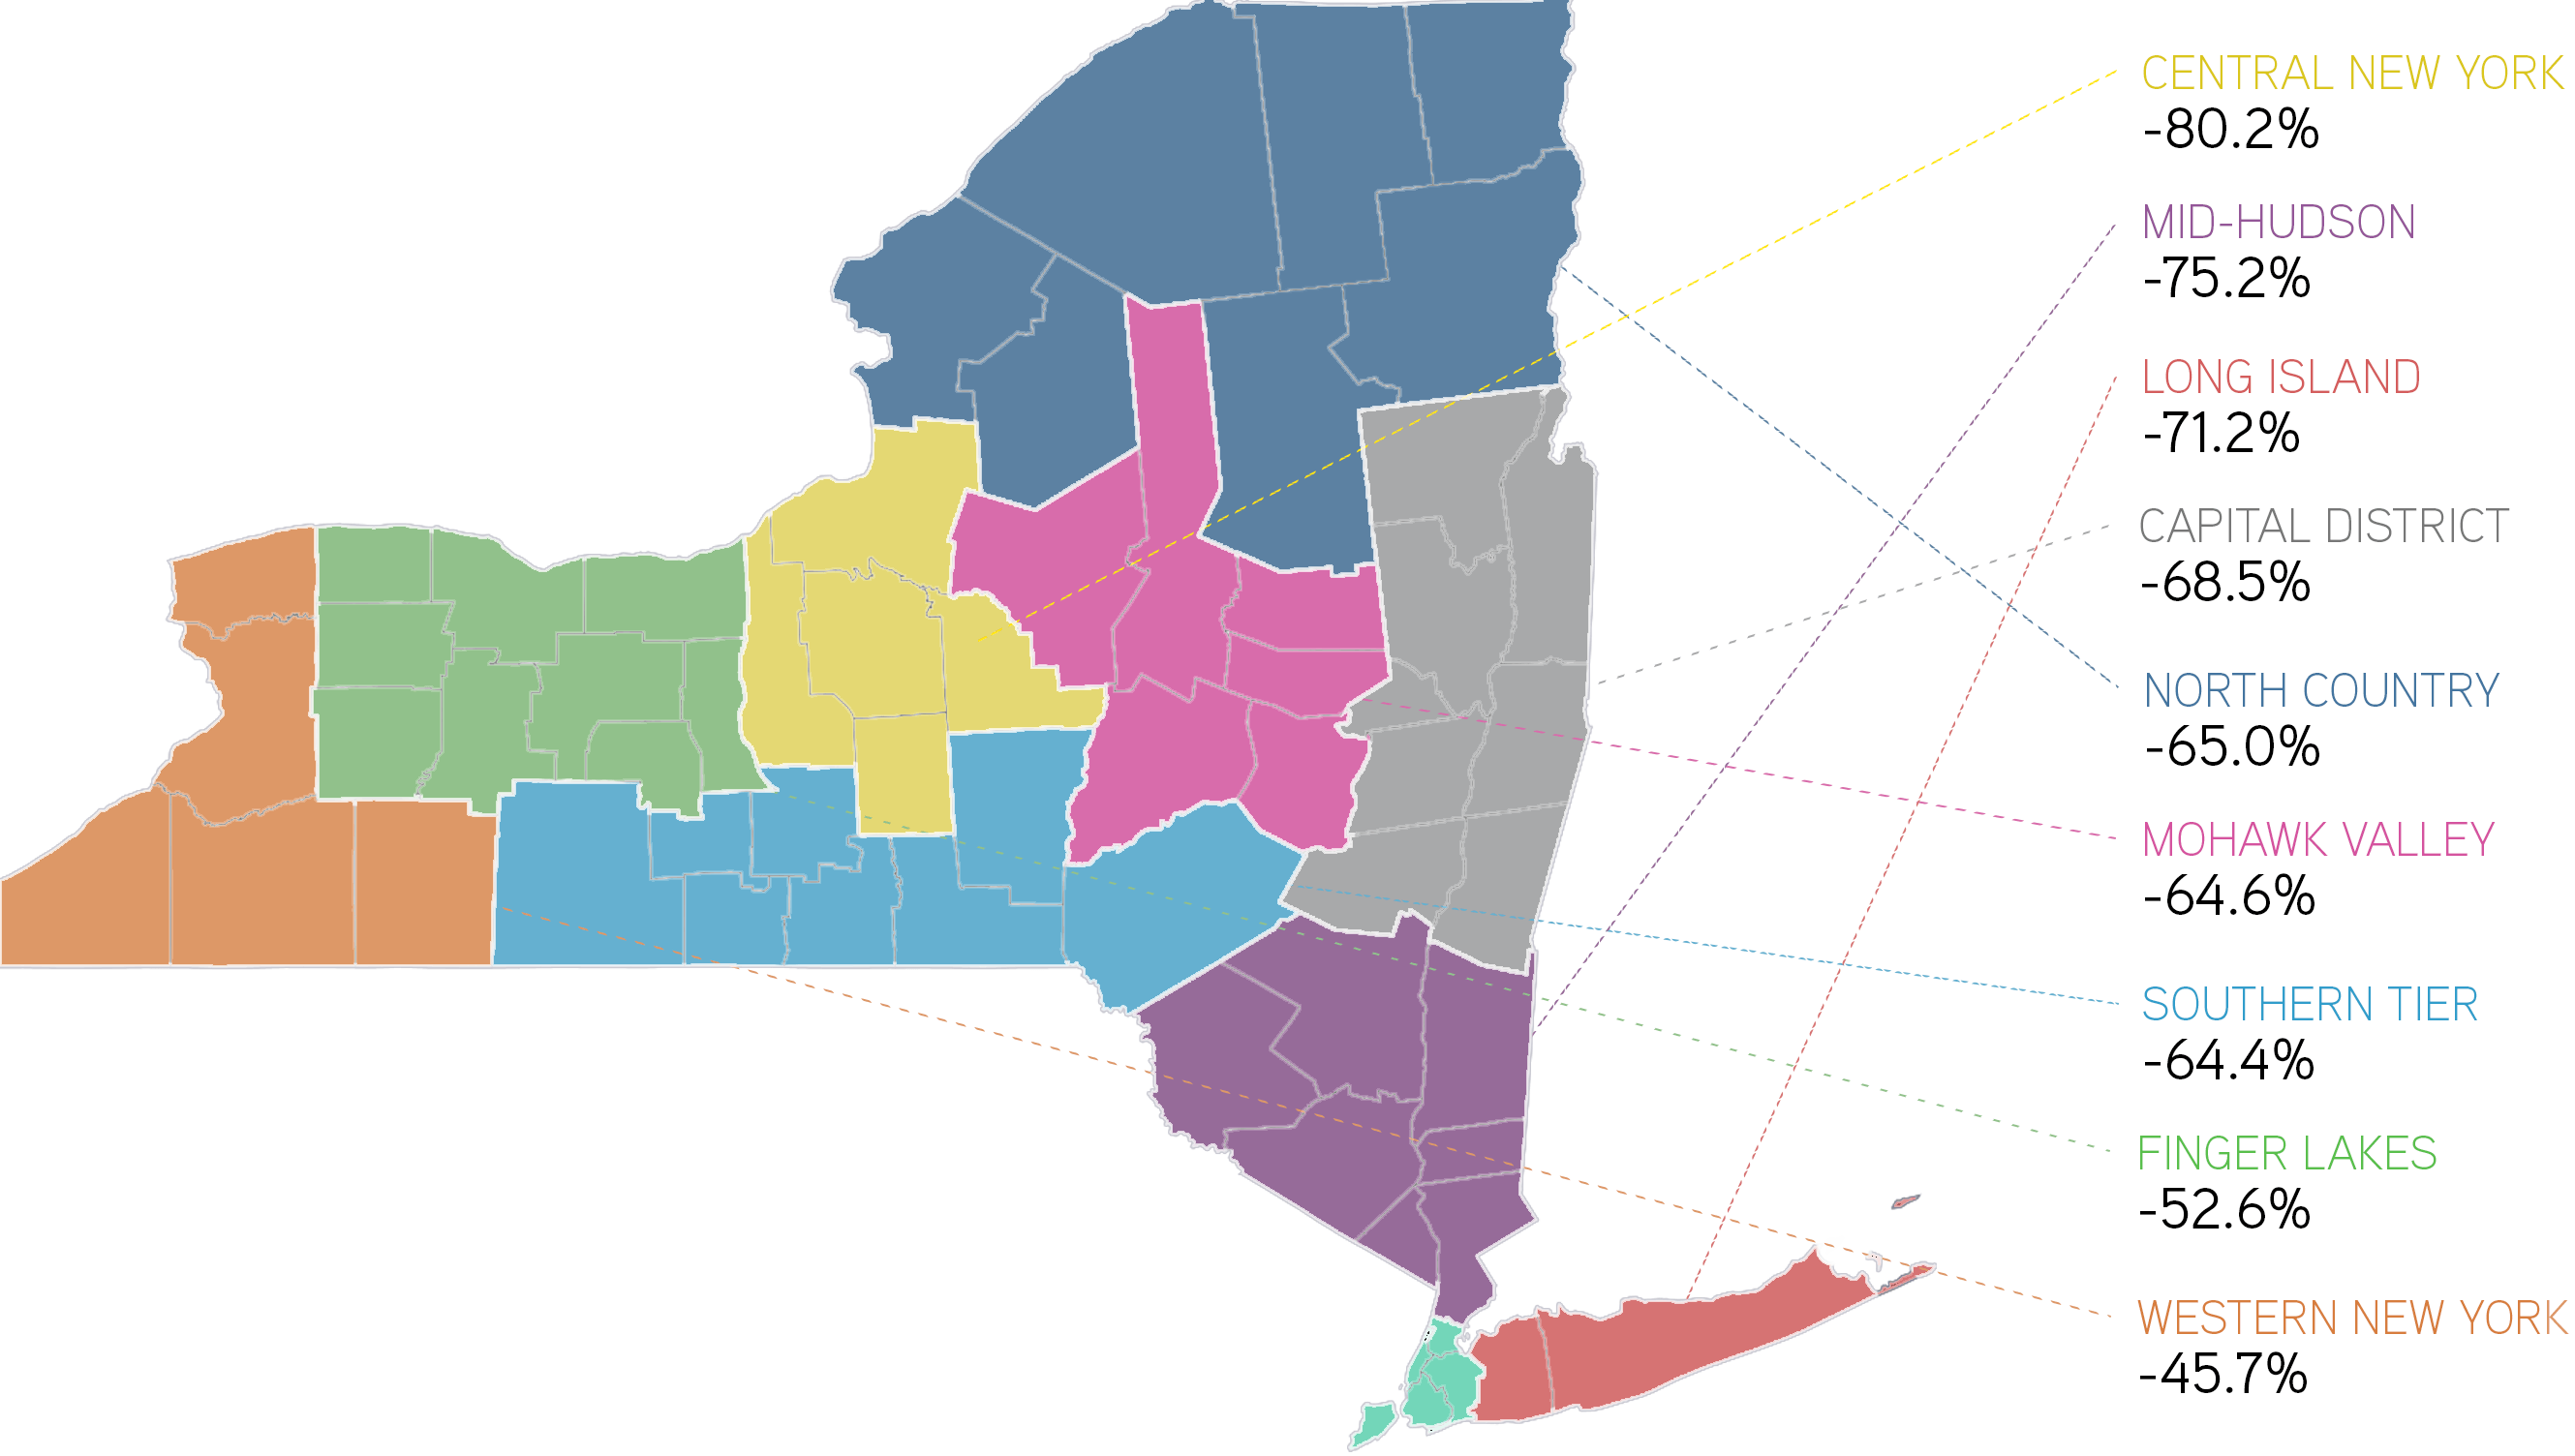
Source: Rockefeller Institute of Government analysis of New York State Education Department Property Tax Report Card data.
Total Regional Property Tax Savings as a Result of the Tax Cap
Using conservative estimates, the tax cap has resulted in more than $16.7 billion in school property tax savings for homeowners.[9] In total dollars, the Long Island and Mid-Hudson Valley regions had the largest savings, mostly because their higher property values and taxes mean that cuts in tax rates result in higher dollar savings. In all, Long Island and the Mid-Hudson regions accounted for nearly 80 percent of the total tax savings.
FIGURE 5. Regional School Property Tax Savings as a Result of the Tax Cap — $16.7B in Total Savings
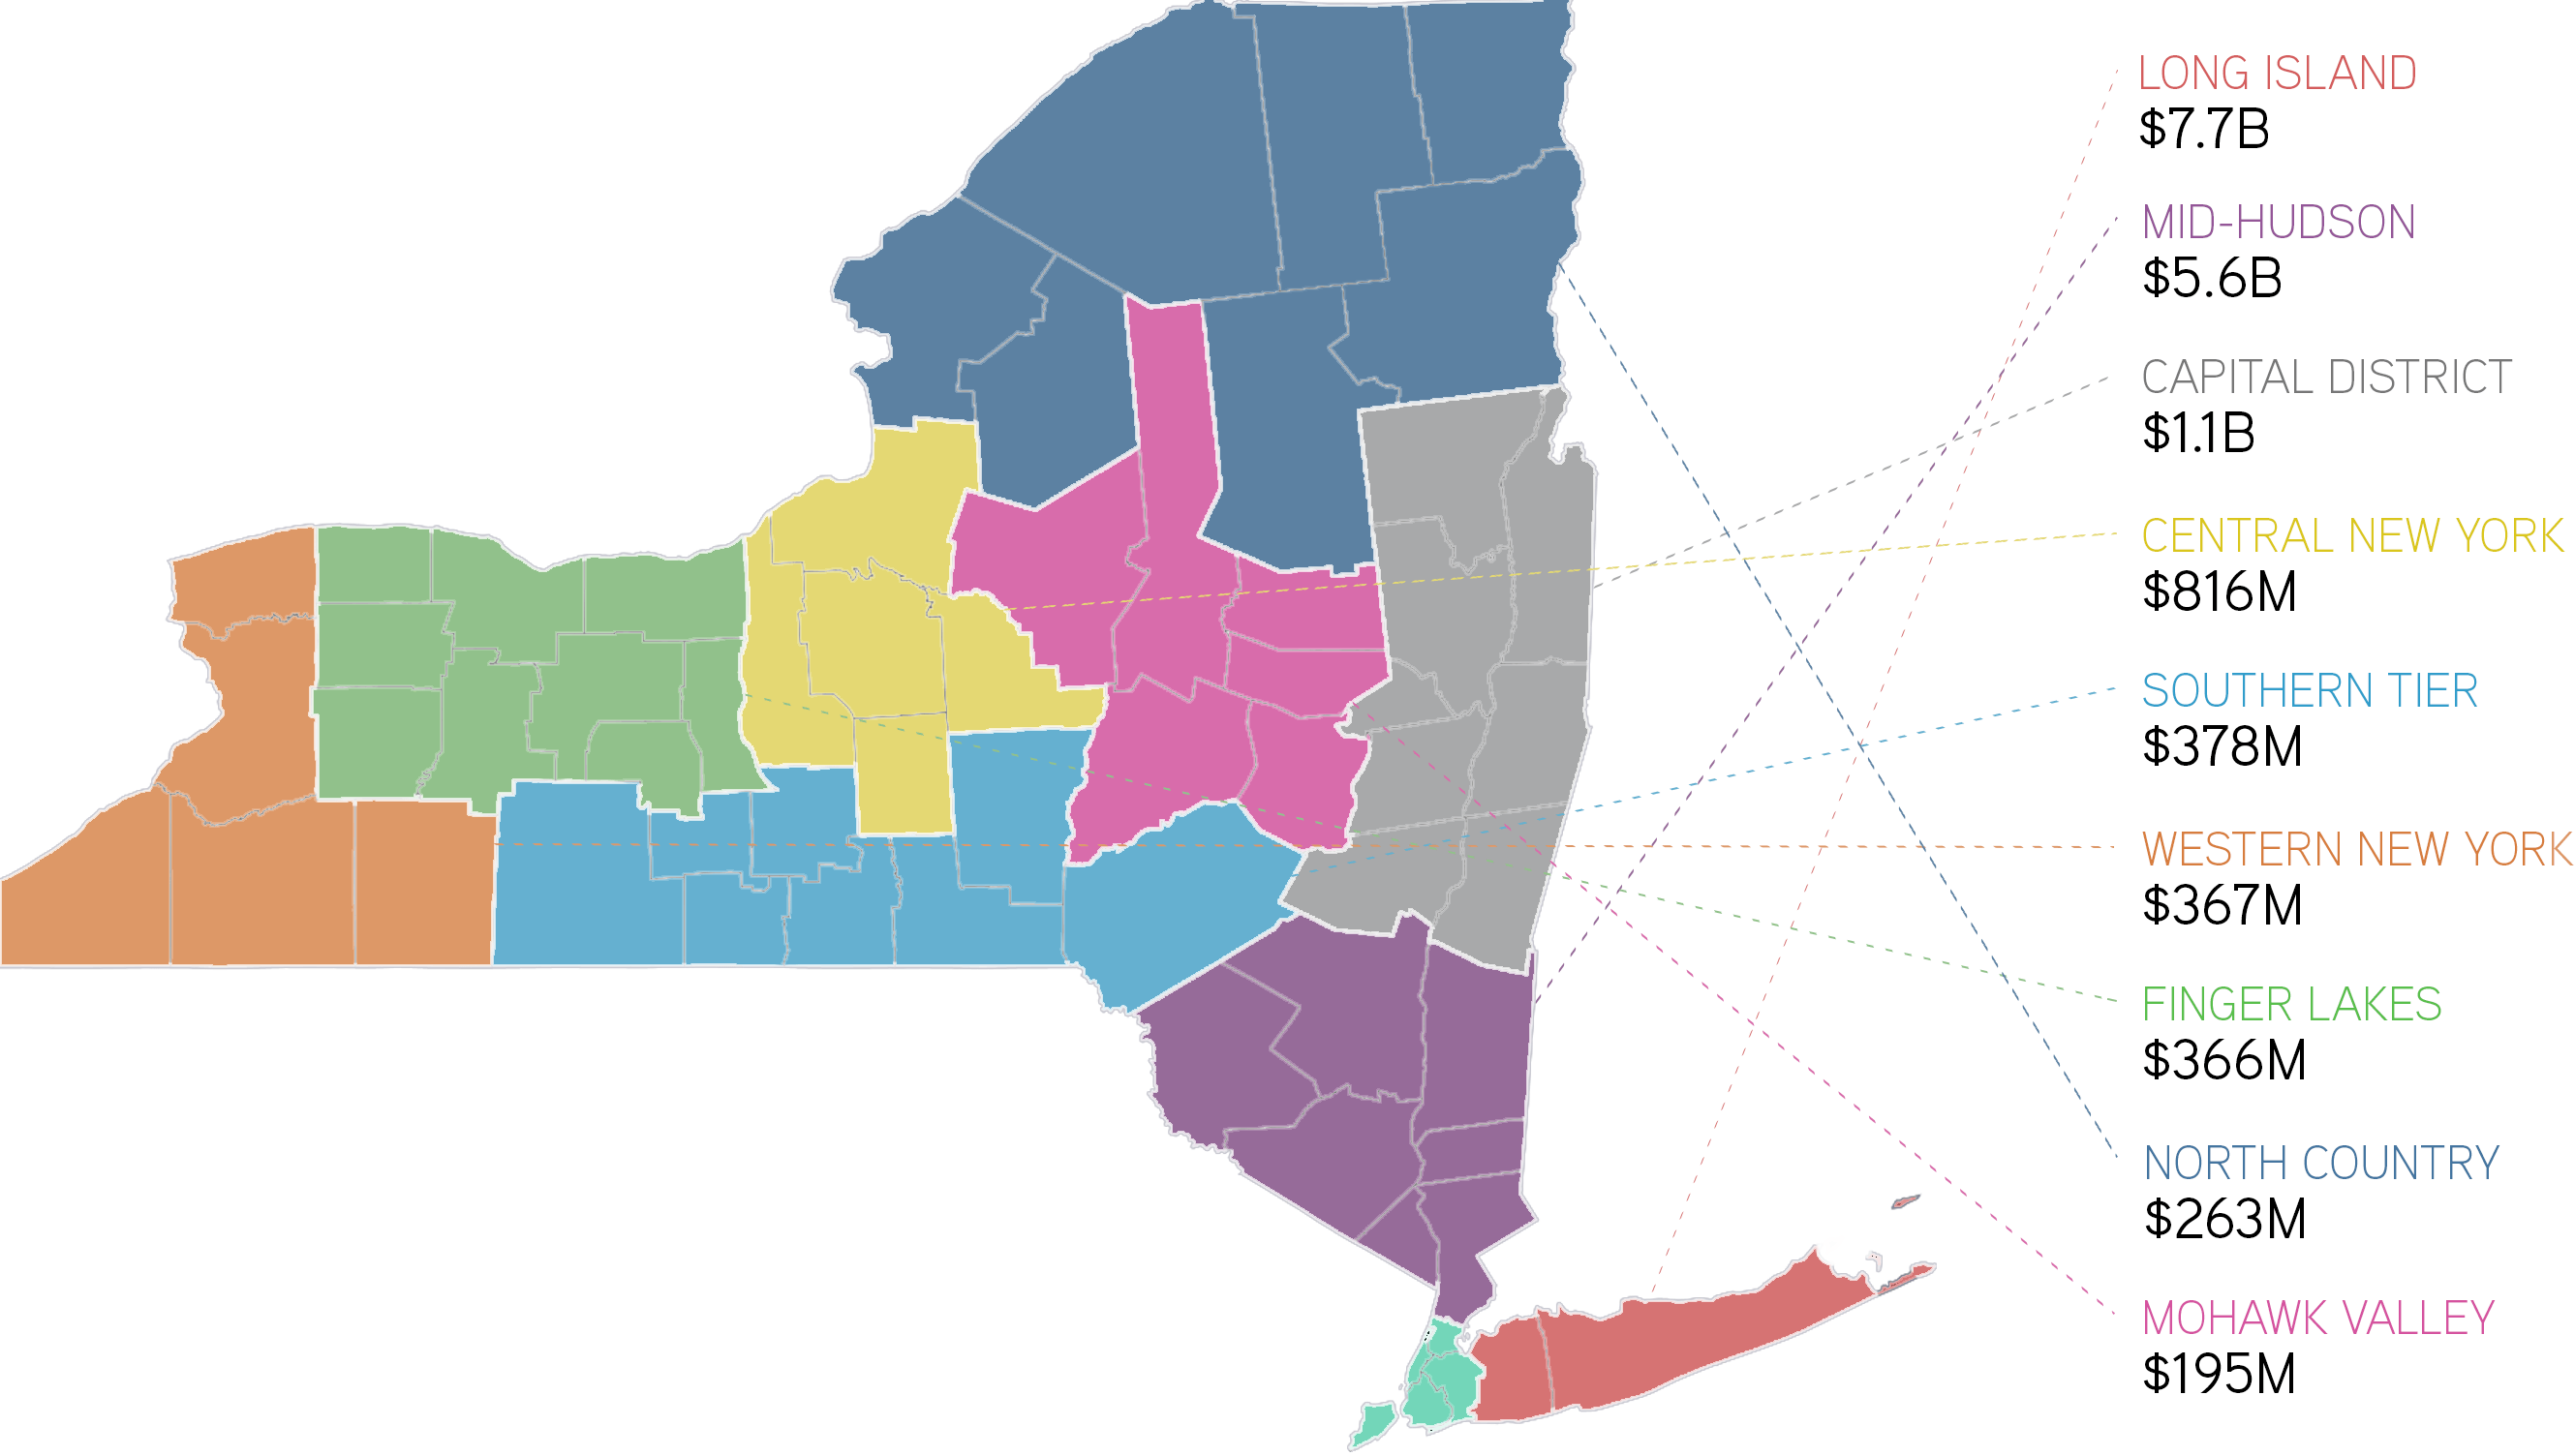
Source: Rockefeller Institute of Government analysis of New York State Education Department Property Tax Report Card data.
Tax Cap Overrides by School Districts in Every Region
In our previous analysis, we found that statewide most school districts complied with the tax cap. Regionally, most school districts have complied with the tax cap over the past seven years as well, suggesting broad political and community support in every region (see Figure 6).
FIGURE 6. Average Annual Percentage of School Districts Overriding the Tax Cap
Source: Rockefeller Institute of Government analysis of New York State Education Department Property Tax Report Card data.
Taxpayers in each region of the state have benefited from the tax cap, with each region considerably reducing the growth in school property taxes. While school property taxes have been lowered, the state has simultaneously increased state education aid, creating a more progressive funding model.
The question remains whether lower property taxes will continue by extending or making the tax cap permanent or will the tax cap sunset or be dramatically altered and less effective? The state Senate has passed a bill that would make permanent the property tax cap in its current, strong form. The ball is now in the Assembly’s court.
NOTES
[1] See, for instance, Empire Center for Public Policy’s analysis of property taxes and the property tax cap at https://www.empirecenter.org/ec_tag/property-tax-cap/.
[2] Dr. Malatras was an architect of the property tax cap law in 2011. Special thanks to Patricia Strach, Heather Trela, Brian Backstrom, and Katie Zuber for their comments.
[3] Senate bill 1904 of 2019 (Gaughran). The bill passed by 58-2 on January 23, 2019.
[4] The speaker has suggested that this may be part of a larger negotiation strategy to get a stronger housing reform package for New York City. See Karen Dewitt, “Tax Cap Measure Passes NY Senate, Stalls In Assembly,” WAMC/Northeast Public Radio, January 27, 2019, https://www.wamc.org/post/tax-cap-measure-passes-ny-senate-stalls-assembly. The Assembly Republican Conference has also proposed loosening up the cap. See Ken Girardin, “Assembly GOP wants higher taxes,” Empire Center for Public Policy, January 29, 2019, https://www.empirecenter.org/publications/assembly-gop-wants-higher-taxes/.
[5] New York City isn’t included because it is not subject to the cap.
[6] We start with 2004 data, the starting year with the most reliable available data.
[7] See the inflation rate from the Consumer Price Index data from the U.S. Bureau of Labor Statistics. The inflation rate at that time was around 3.5 percent.
[8] The Finger Lakes region experienced slightly higher average annual school property tax increases after the tax cap compared to the Great Recession years (1.9 percent during the Great Recession versus 2.2 percent after the tax cap), but the post-tax cap level still was significantly lower than the pre-Great Recession average annual increase of 4.6 percent.
[9] We developed a model, which examined the average property tax increase prior to and during the Great Recession (2004-11) for every region to estimate what property taxes would have been if the tax cap had not been instituted. We used the following calculated averages for each region: Capital District (4.30 percent), Central (4.36 percent), Finger Lakes (3.12 percent), Long Island (5.01 percent), Mid-Hudson (5.23 percent), Mohawk Valley (3.83 percent), North Country (4.29 percent), Southern Tier (3.92 percent), and Western (3.22 percent). We applied these rates to the tax levy of each region for each year, from 2012 to 2018, to generate a projected tax increase. We then subtracted the projected no-cap tax increase from the actual tax increase under the property tax cap to approximate the amount of savings per region during that time frame.
Jim Malatras is president of the Rockefeller Institute of Government
Nicholas Simons is a project coordinator at the Rockefeller Institute of Government
Michelle Cummings is a fiscal policy analyst at the Rockefeller Institute of Government