This is the first in a series on property taxes in New York State by the Rockefeller Institute of Government. Collaborating with other organizations[1], the Rockefeller Institute will take an in-depth look into various issues surrounding property taxes including their impact on local governments, case studies of how the tax cap is working in school districts, the future of education financing and its reliance on local property taxes, and property tax assessments.
Newly minted Democratic Majority Leader and Temporary President of the State Senate, Andrea Stewart Cousins, said the Senate would take up a bill to make the local property tax cap permanent this week.[3] New York State has some of the nation’s highest property taxes, be it in total dollars paid (in the downstate suburbs, like Nassau and Westchester Counties) or by home value (in many upstate counties, like Orleans and Wayne).[4] In response, the state enacted in 2011 a local property tax cap law that restricted annual property tax increases to 2 percent or the rate of inflation, whichever is less. While the tax cap has limited local property taxes, it also has an effect on the distribution of school revenue (with more money coming from progressive state income taxes) and higher passage rates for school budgets.
The property tax cap was not made permanent. It was part of a larger horse-trading deal that included strengthening and extending rent regulations on housing, primarily in New York City. As part of the original deal, the local property tax cap was scheduled to sunset after four years unless reauthorized by the state legislature and signed by the governor. The tax cap was extended once in 2015 and is once again up for renewal in 2020.[5]
Support for the tax cap is driven more by what region a legislator is from than by party identification. The State Senate’s push to make the tax cap permanent stems mostly from the new Democratic majority’s suburban and upstate members. The tax situation in these communities is made particularly difficult given the pressure the recent federal Tax Cut and Jobs Act — which eliminated the state and local tax deduction (SALT) above $10,000 — put on suburban communities. In other words, because of changes to SALT, many New Yorkers’ property tax liability will increase because they can’t write off a percentage of it from their federal taxes.
The majority Democratic conference in the State Assembly remains less than enthusiastic about the tax cap, however — especially making it permanent. Powerful Albany interest group politics has much to do with the Assembly’s opposition, given that New York City and school districts in the cities of Buffalo, Syracuse, Rochester, and Yonkers — where a lion’s share of the Assembly majority reside — are exempted from the cap.
Property Tax Cap Basics
The tax cap applies to all local governments, special districts (such as fire and library), and school districts. Since the budgets of local government in New York are not approved by residents of the community, a supermajority of the local legislative body of counties, towns, and villages is necessary to override the tax cap.
School budgets must ultimately be approved by residents of the district. The tax cap requires districts that exceed the cap to get a 60 percent supermajority vote as opposed to 50 percent for budgets under the cap. Moreover, the law requires that the district must include language on their ballot if their budget exceeds the tax cap so voters are informed.
If a cap-busting budget is defeated, a school district may take two additional votes, but if both revotes fail, the law requires the district to enact a flat budget, imposing a zero-growth cap. The law allows certain spending to be exempt from the cap for school districts and local governments, including some pension benefits and legal judgments.
The Long and Winding Road to the Property Tax Cap
The local property tax cap was not a new or novel idea in New York State. In 1995, the Assembly Democratic Majority proposed “limiting growth in local tax levies to the rate of inflation.”[6] The bill passed 144-1 with only one Republican voting against it. In 2008, Governor Paterson, based on findings of the Commission on Property Tax Relief, proposed a tax cap of 4 percent only for school districts.[7] Prior to 2011, however, enacting a tax cap proved elusive in large part because of powerful interest groups that did not want to risk limiting the tax revenue that could flow to school districts.
The Tax Cap Has Significantly Reduced School Property Taxes Over the Past Seven Years
School districts represent nearly 70 percent of the total local property tax burden, and are the subject of this first-in-the-series analysis. Prior to the adoption of the tax cap, school property taxes grew rapidly nearly every year — some years twice the rate of inflation.[8]
Overall, the tax cap has successfully reduced the rate of property tax growth — some estimates have found more than $25 billion in savings to taxpayers since its enactment.[9] Annual school property tax increases have steeply declined since the tax cap went into effect in 2012. From 2012 to 2018, the property tax cap has reduced average annual tax increases in school districts statewide to 1.9 percent (Figure 1). By comparison, during the Great Recession, where spending was down across the board, the average school property tax increases still rose 3.1 percent. Before the Great Recession, it was even greater: between 2004 and 2008 the average annual school property tax increase was 6.6 percent — or more than three times the rate of property tax growth under the cap.
After the property tax cap was enacted and local property tax increases averaged 1.9 percent, state aid for education increased 5.2 percent. In other words, while the state capped the local property tax, viewed as more regressive, it increased state spending on education funded by the more progressive income tax.[10]
Figure 1. Average Annual School Property Tax Increases
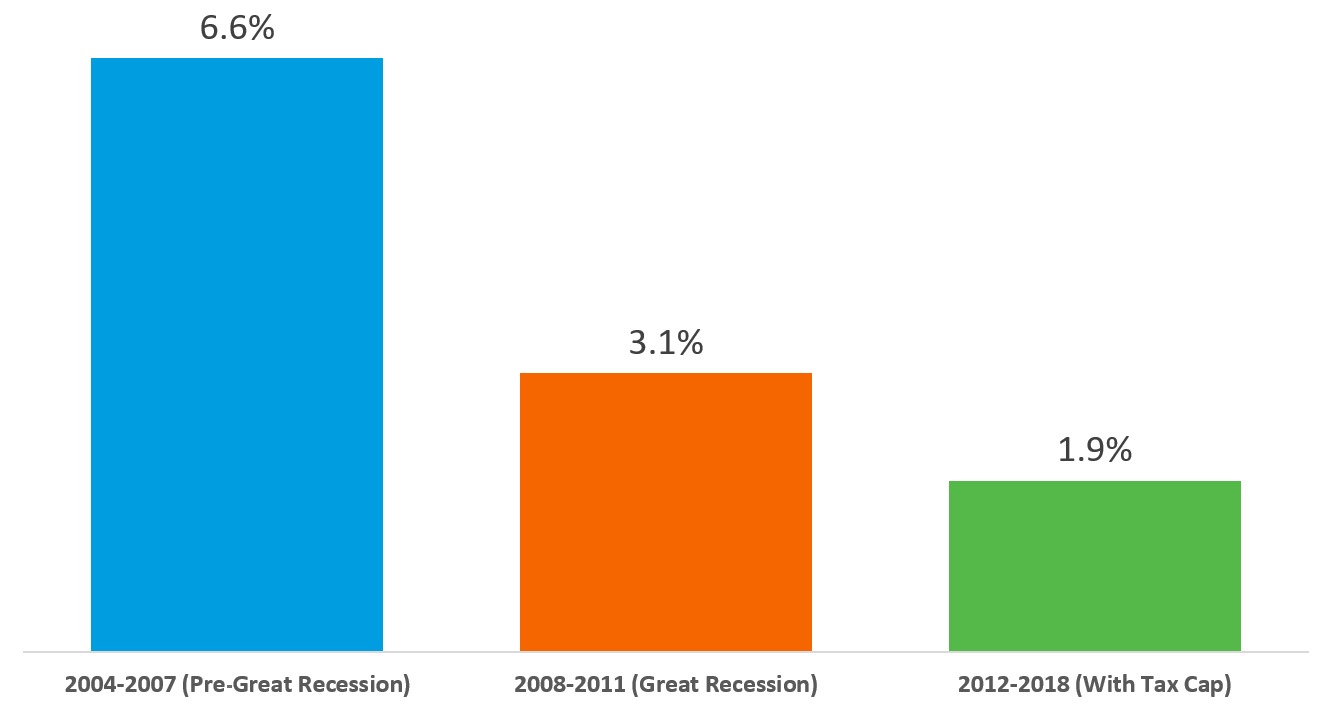
Source: Rockefeller Institute of Government analysis of State Education Department Property Tax Cap Report Card Data.
After the Property Tax Cap Approval of School Budgets Has Increased
As the data below show, the property tax cap has not only significantly cut the growth of school property taxes, but helped stabilize the adoption of school budgets as well. Prior to the tax cap, the percent of school budgets approved by voters was much more volatile than after the tax cap was in place (Figure 2). Voters responded to the pressure the tax cap created to regulate school district spending by approving proposed budgets more regularly.
Since the tax cap, more than 95 percent of school budgets have been approved every year. Prior to the cap there were years when less than 85 percent of school budgets passed.
Figure 2. Percentage of School Budgets Passed on First Vote, 2004-18
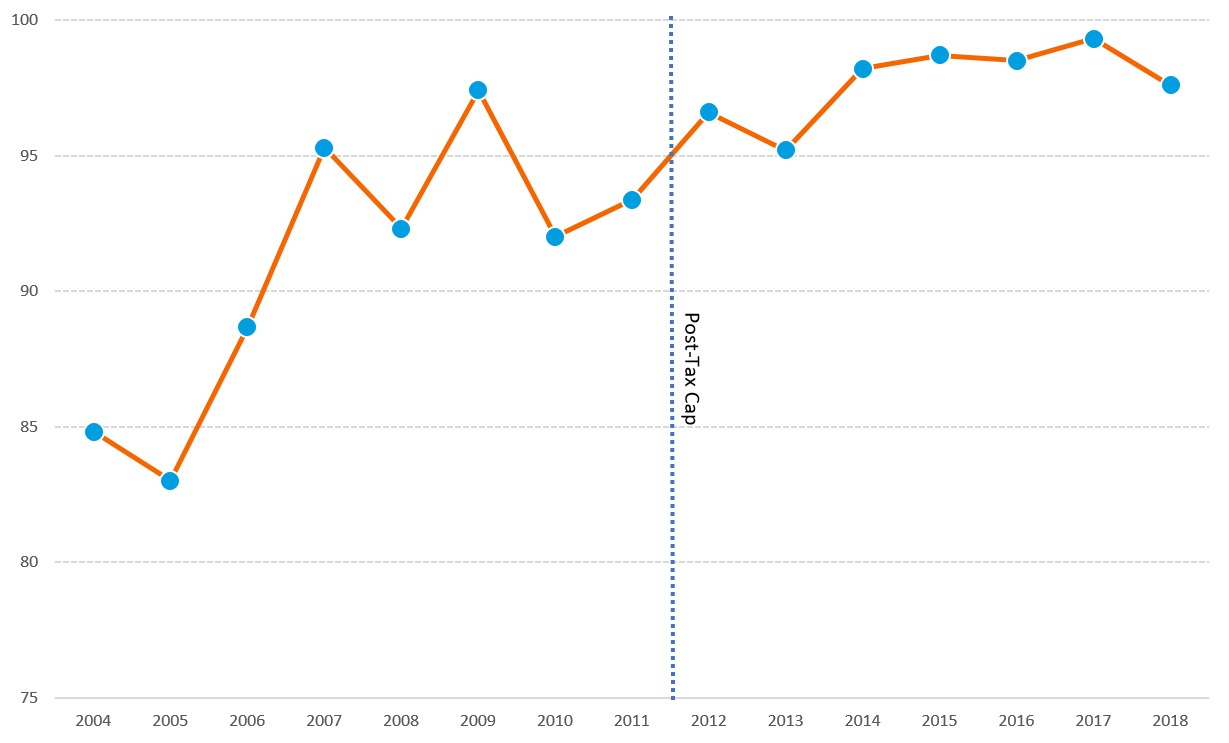
Source: Rockefeller Institute of Government analysis of State Education Department Property Tax Cap Report Card Data and Budget Vote Results Data
School district budgets that exceed the tax cap in any given year do not enjoy the same rate of voter approval, however. Each year a number of districts exceed the tax cap (Figure 3) and in those districts there was a far lower approval rate on the first budget vote.
Figure 3. Percentage of Districts Exceeding the Tax Cap Annually
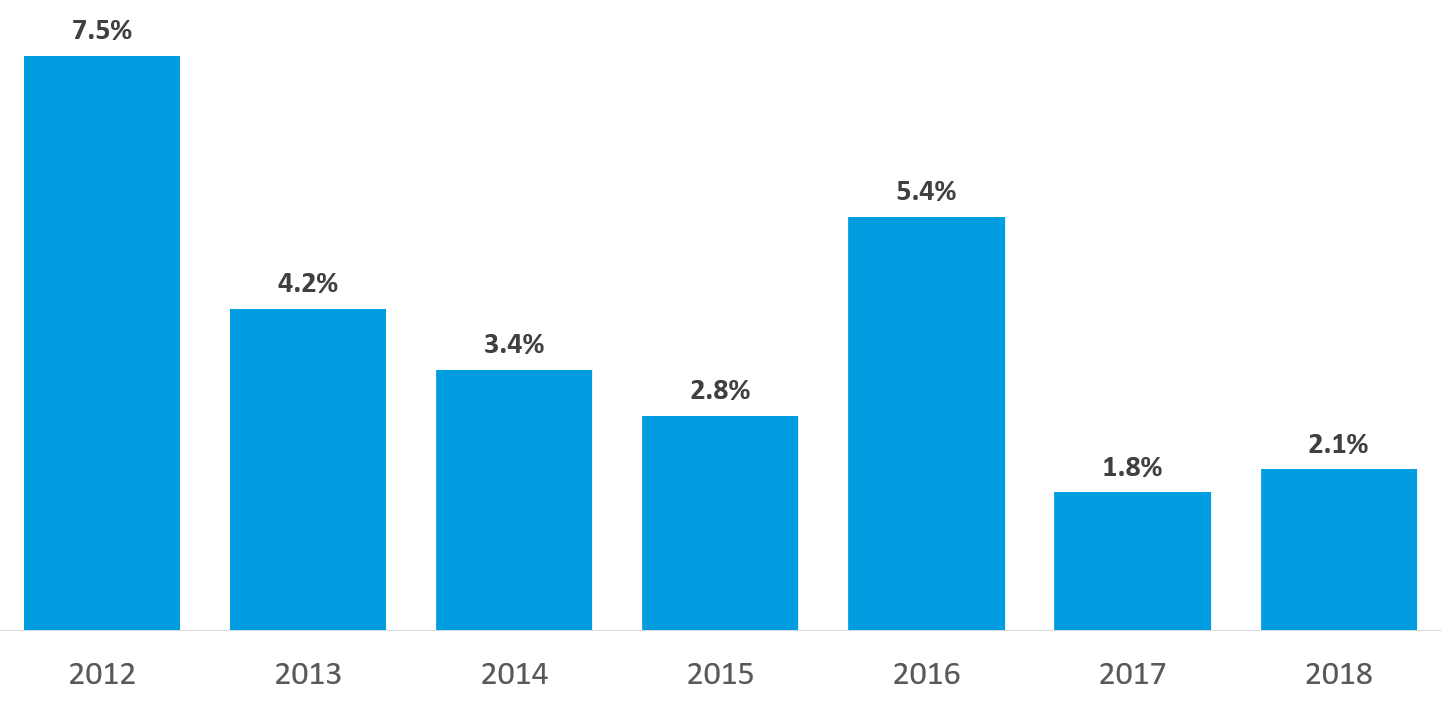
Source: Rockefeller Institute of Government analysis of State Education Department Property Tax Cap Report Card Data
The average total percentage approval for all school districts under the cap from 2012-18 was 97.7 percent, yet for districts that exceeded the cap the average approval was only 62.5 percent — more than thirty points worse.
Not only are school district budgets exceeding the tax cap defeated more often, the chance that these cap-busting budgets will be approved varies greatly from year to year (Figure 4). For instance, in 2012, 64 percent of the district budgets over the cap were approved, while the next year only 25 percent were. Districts proposing budgets that fall under the cap enjoy far greater stability of voter approval than those proposing budgets that exceed the cap.
Figure 4. Percentage of School Budgets Voters Approved Under the Tax Cap Versus Budgets Voters Approved Exceeding the Tax Cap
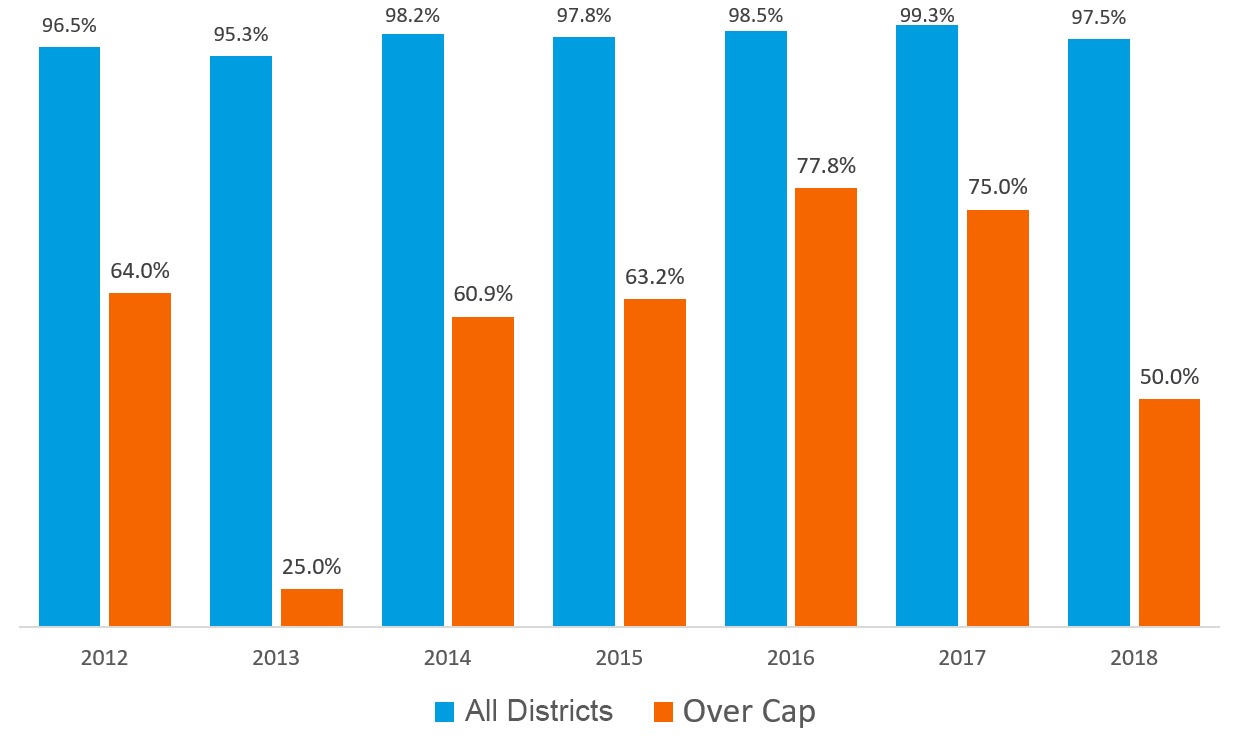
Source: Rockefeller Institute of Government Analysis of State Education Department Property Tax Cap Report Card Data and Budget Vote Results Data[11]
For School Districts that Pierced the Cap, the Higher the Property Tax Increase, the More Likely the Budget Will Be Defeated
Examining school budget votes in more detail shows another interesting trend. Except for one year, 2014, the higher the property tax increase, the more likely the budget would be defeated (Figure 5). Between 2012 and 2018, the average property tax increase approved by voters under the cap was 1.9 percent. For those districts that exceeded the cap, the average property tax increase approved by voters was 3.6. And where voters defeated budgets over the tax cap, the average property tax increase was 4.2 percent.
Figure 5. Average School Property Tax Increases Under Cap Versus Exceeding the Cap
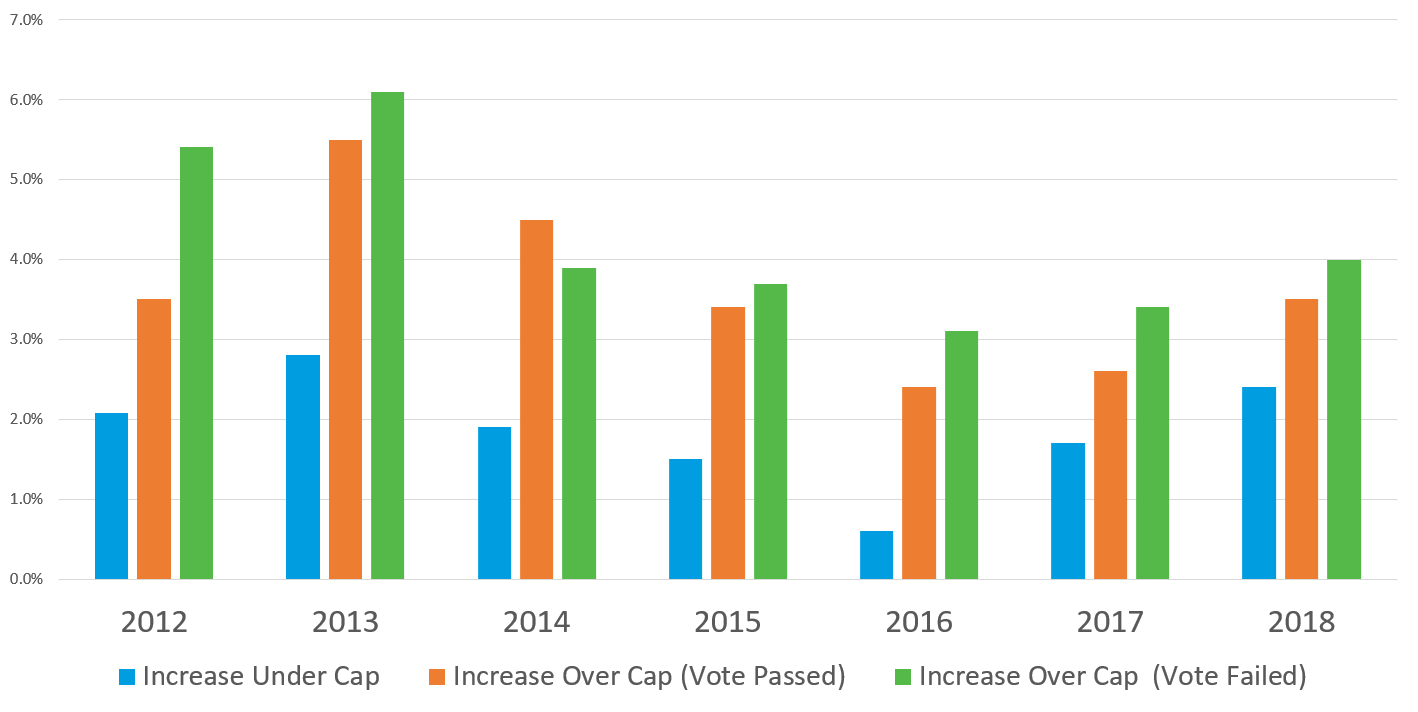
Source: Rockefeller Institute of Government Analysis of State Education Department Property Tax Cap Report Card Data
Looking Forward
The property tax cap remains popular with voters and has reduced homeowners’ property taxes considerably. It will be interesting to watch the debate in the State Senate and whether the State Assembly takes action. Part of the equation — and something to watch for — is if any permanent tax cap bill includes additional exemptions. Since its inception, there have been calls to loosen the cap, allowing localities and school boards to raise taxes to cover spending that gets counted out from under the cap. It will be interesting to see if the final deal trades permanence of the cap for reduced effectiveness of that cap, for example. Whether overtaxed homeowners would be willing to go along with such effort remains to be seen.
NOTES
[1] See, for instance, Empire Center for Public Policy’s analysis of property taxes and the property tax cap at https://www.empirecenter.org/ec_tag/property-tax-cap/.
[2] Jim Malatras was one of the architects of the property tax cap for Governor Andrew M. Cuomo. Special thanks to Patricia Strach, Brian Backstrom, Heather Trela, Laura Schultz, and Katie Zuber for their thoughtful comments.
[3] Yancey Roy, “NY Senate to vote to make property-tax cap permanent,” Newsday, updated January 17, 2019, https://www.newsday.com/news/region-state/tax-cap-cuomo-gaughran-1.26063138. See also Senate Bill 1904 of 2019 (Gaughran), “Eliminates the expiration of and makes permanent provisions of law establishing the property tax cap.”
[4] See A Review of the Plans Submitted Under the State County-Wide Shared Services Initiative (Albany: Rockefeller Institute of Government, October 17, 2017): 10-1, https://rockinst.org/wp-content/uploads/2017/11/2017-10-17_NYS_CWSSI_Report-1-min.pdf.
[5] N.Y. Chapter 20 of the Laws of 2015.
[6] Assembly bill 6171 of 1995.
[7] Bob Conner, “Paterson to propose school property tax cap,” Schenectady Gazette, June 4, 2008, https://dailygazette.com/article/2008/06/04/0604_taxcap.
[8] Property tax increase from NYS Education Department Budget Vote Results. Inflation rate from the Consumer Price Index data from the U.S. Bureau of Labor Statistics. For instance, in 2004 the average school property tax increase was more than 8.5 percent compared to inflation of just over 3.5 percent, further driving up the state’s nation-leading property tax burden.
[9] Governor Andrew M. Cuomo’s 2019 State of the State Justice Agenda Policy Book (Albany: Office of the Governor): 41, https://www.governor.ny.gov/sites/governor.ny.gov/files/atoms/files/2019StateoftheStateBook.pdf.
[10] Calculation based on state aid from 2012-16, the latest data available. Rockefeller Institute of Government calculation of the NYS Education Department’s “Fiscal Profile Reporting System” data, last updated September 17, 2018, (http://www.oms.nysed.gov/faru/Profiles/profiles_cover.html).
[11] We caution that the 2014 voting data have some issues. While it does not appear to affect the overall trend, there are numerous school districts missing from reporting.
Jim Malatras is president of the Rockefeller Institute of Government
Nicholas Simons is a project coordinator at the Rockefeller Institute of Government
Michelle Cummings is a fiscal policy analyst at the Rockefeller Institute of Government
MORE IN THE SERIES
As Albany Debates a Permanent Property Tax Cap, How Is the Cap Affecting School Budgets?
By the Numbers: Regional School Property Tax Growth under the Tax Cap
If the Cap Fits, Let Them Wear It