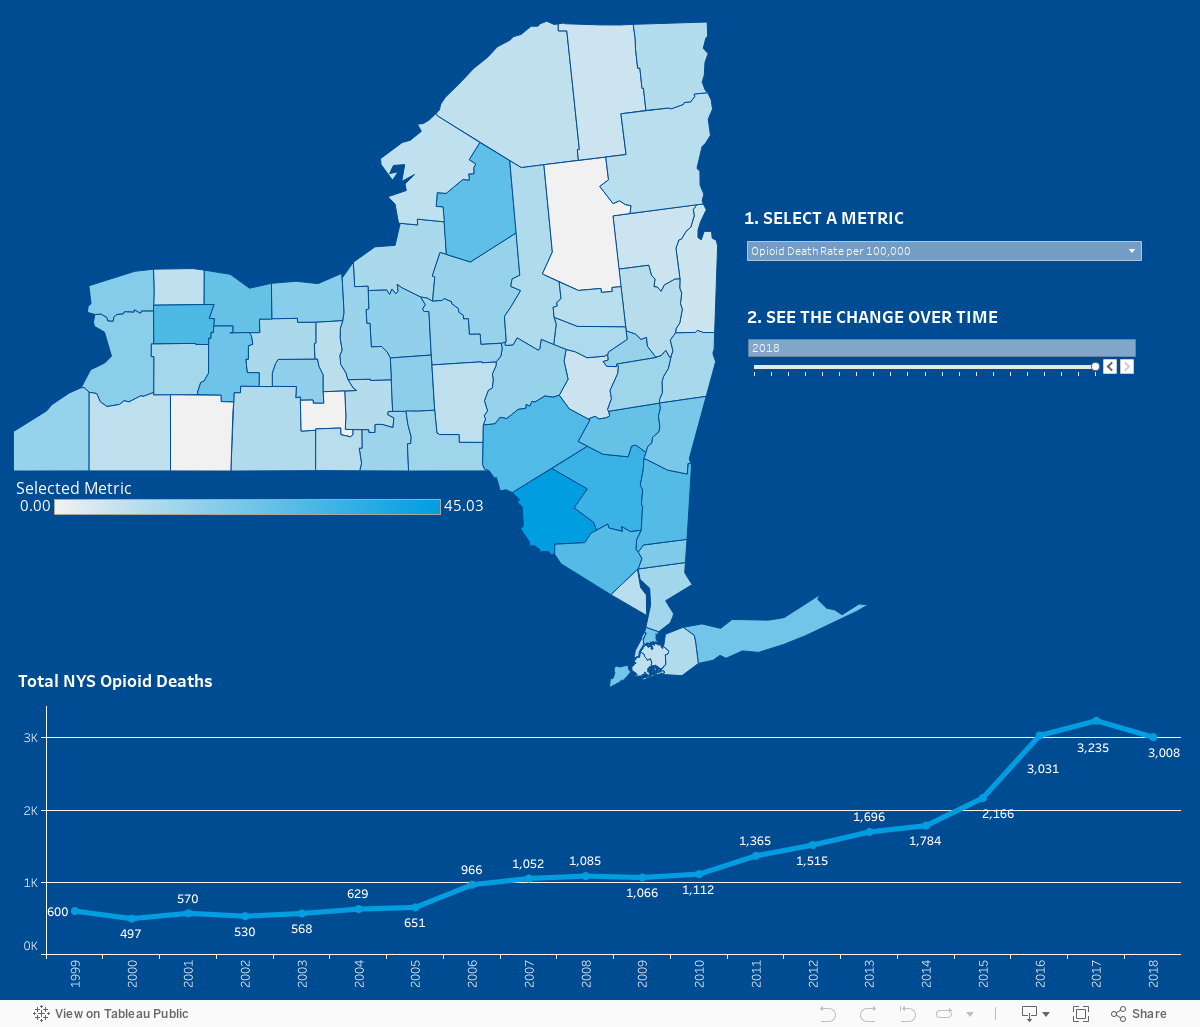
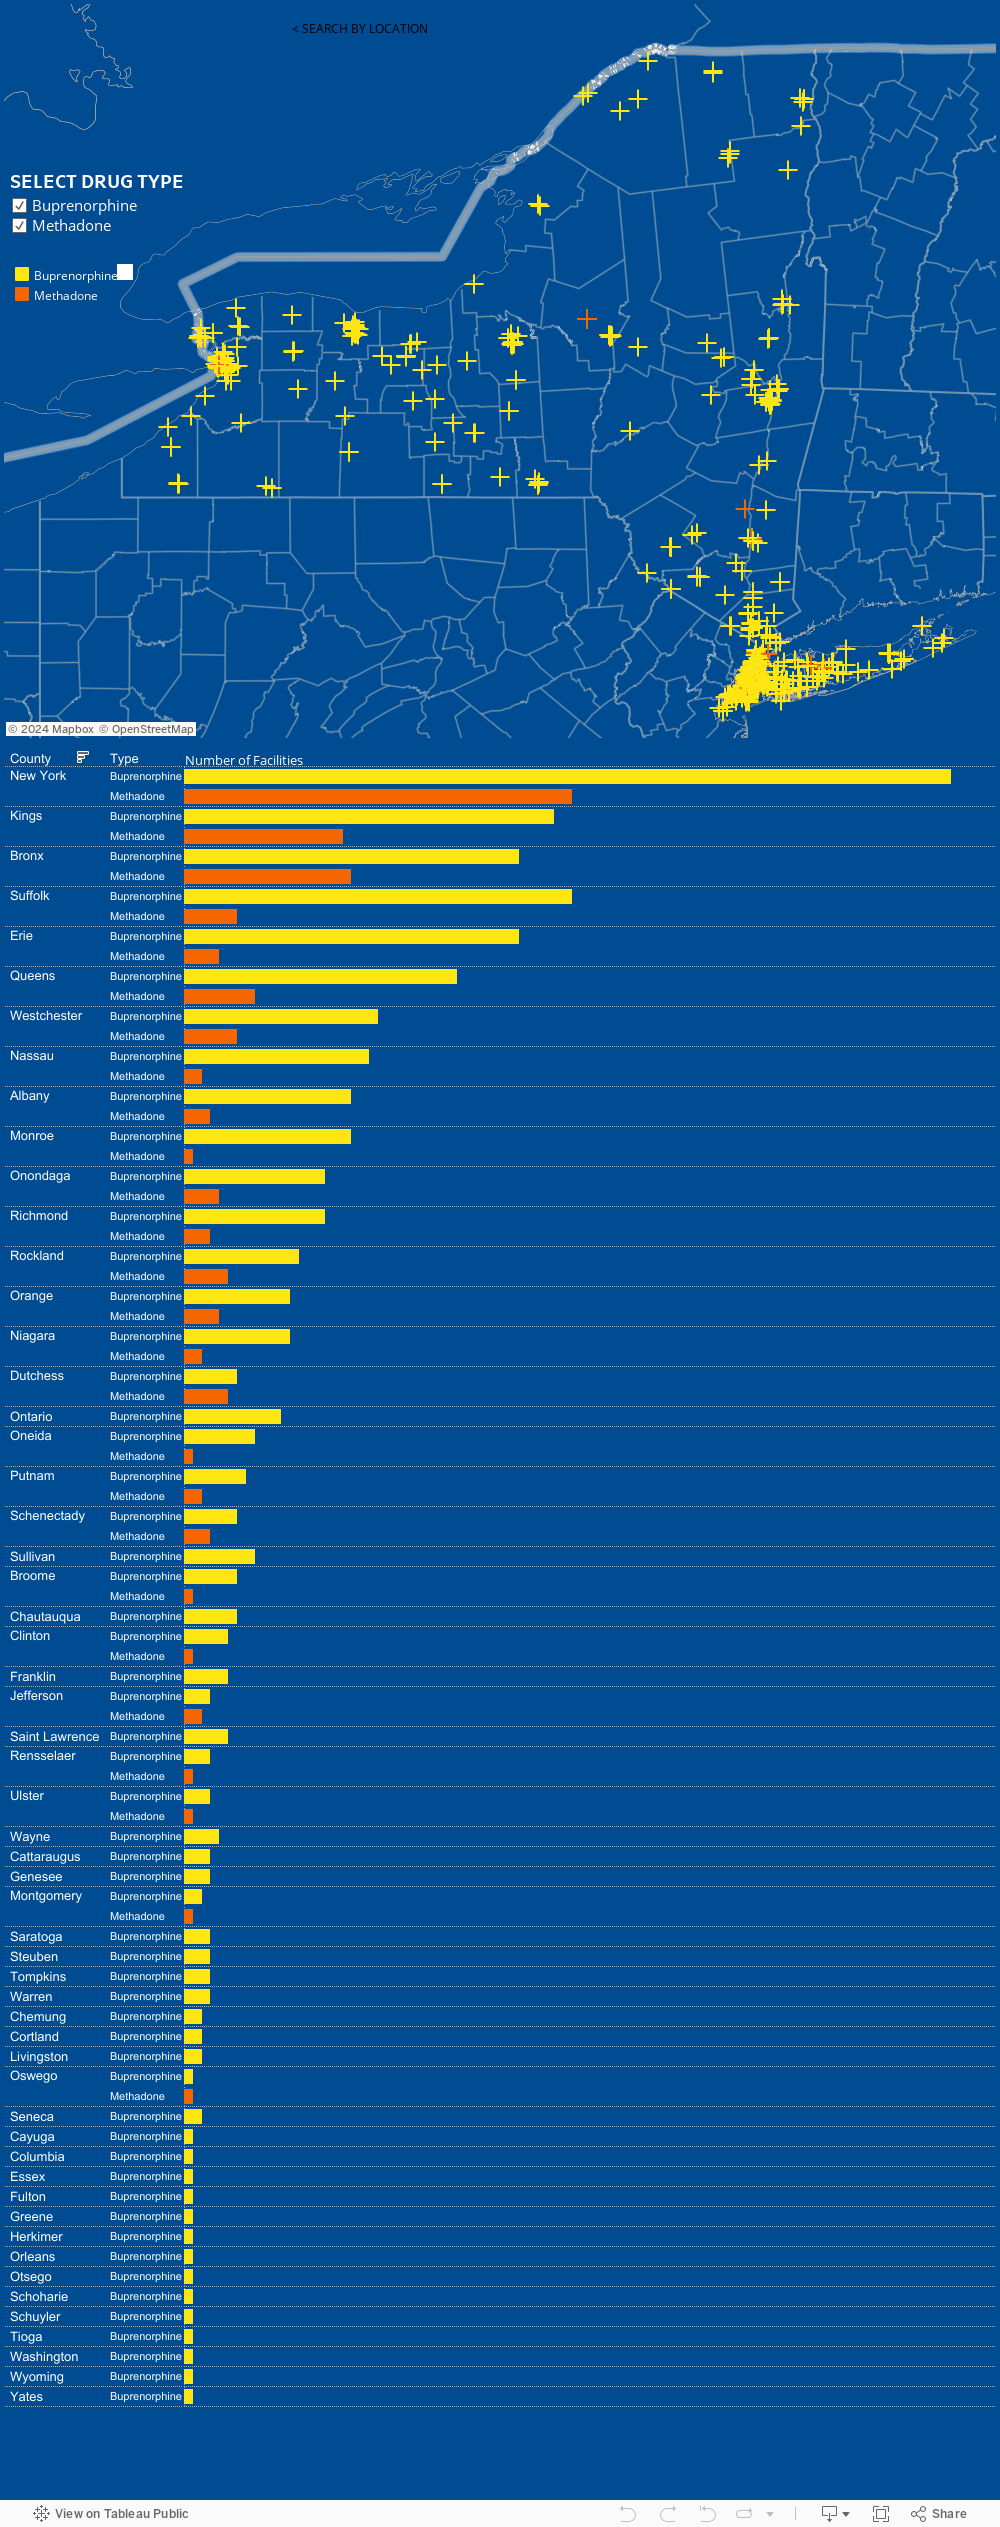
Even as the opioid crisis has worsened and garnered widespread attention, in New York and beyond it has remained easier for doctors to prescribe opioids than to prescribe medication-assisted treatment (MAT) to aid in recovery. The maps below show opioid mortality and prescribing trends by county across New York State from 1999 to 2018, as well as the availability of treatment centers that provide medication-assisted treatment.
Opioid Mortality & Prescription Rates | Access to MAT | Notes
DEFINITIONS
Total Opioid Deaths: The raw total number of opioid deaths in a county.
Opioid Death Rate per 100,000: The total number of opioid deaths divided by the county population, which is then multiplied by 100,000.
Opioid Prescribing Rate per 100: The rate of retail opioid prescriptions dispensed per 100 people.
DATA NOTES
The CDC suppresses data for small cell sizes, generally those identifying fewer than 10 people or that could otherwise result in revealing individual identifying information about a death. To provide information on these, generally rural, counties we calculate the three-year or five-year averages of total opioid deaths and the resulting average opioid death rate per 100,0000. We note when these average calculations are used. To further prevent individual identification, we use fixed year span averages not floating averages.
We report death rate per 100,000 calculations for counties where the CDC reports total deaths but deems the death rate per 100,000 as unreliable. This should be taken into account in any statistical model.
Data on opioid prescribing rates for Hamilton County are missing from the CDC data.
DATA SOURCE
Centers for Disease Control (CDC) WONDER Database, Multiple Cause of Death Dataset, 1999-2018; UCD—Drug/Alcohol Induced Cause Codes: X40-X44, X60-X64, X85, Y10-Y14; MCD—ICD-10 Codes: T40.0, T40.1, T40.2, T40.3, T40.4, T40.6 https://wonder.cdc.gov/mcd.html
Centers for Disease Control (CDC) U.S. Opioid Prescribing Rates 2012-2018 https://www.cdc.gov/drugoverdose/maps/rxrate-maps.html