
July 17, 2017
In our July State Revenue Report we noted that Rockefeller Institute income tax withholding data suggested that early estimates of wage data for 2016 reported by the U.S. Bureau of Economic Analysis (BEA) might be too high. That is, that the economy might be weaker than commonly understood. BEA’s later revisions to its wage data show that our withholding tax data sent a signal that proved correct. Preliminary wage data were too high.
This example points to an opportunity. The quarterly and monthly state tax data that the Rockefeller Institute collects so carefully may be used to gain insight into economicgrowth. This is “running the model backwards.” Normally, we use economic data to forecast tax data. However, because tax and economic data are typically correlated in predictable ways, we can also use tax data to discern changes in the economy. And because some state tax data, such as withholding data, are available quickly and comprehensively, the tax data could provide timely signals of economic change. The rest of this report shows how this can be done and applies the approach to recent economic trends.
We elaborate below.
Economic data usually are reported in a series of successively improving releases. Preliminary data are released first but, in the interest of timeliness, they are based on fragmentary information and many estimates. They can be subject to large revisions. The nation’s statistical agencies then release better estimates as new information becomes available. This is true of data on wages, the driver of state withholding tax collections and an important component of overall economic growth. Early data are based on estimates from small surveys and inferences from other data sources. Revisions many months later reflect data collected from almost the full universe of employers.
By contrast, some tax collections data, such as deposits of withholding remittances by employers to government bank accounts, are available extremely quickly, just days or weeks after a month or quarter ends. 1 These data have the potential to provide insight into what is happening to wages. Withholding data for any single state may be “noisy” in the sense that they may reflect many noneconomic factors such as legislative changes, changes in tax processing systems, and changes in how a state reports its tax data. However, if we draw on data for all states that have broad-based income taxes, we can filter out some of this noise by focusing on what the data for all states in aggregate are telling us.
State revenue forecasters use formal statistical models to forecast many major taxes and their components, such as withholding on wages under a state income tax. These models will help us estimate the effects of wages on income taxes, and that relationship can in turn be used in the other direction, to gain insight into likely wage growth based on tax data.
Most states have progressive income taxes, with higher rates as people move into higher income brackets. Withholding schedules generally are based on income tax schedules, so they are progressive too. Because marginal withholding rates are higher when wages are higher, income tax withholding generally will rise faster than wages. 2 Table 1 shows this with an illustrative taxpayer. In year one, our taxpayer has wages of $50,000. In year two, wages rise 5 percent, to $52,500. This taxpayer’s state has a progressive income tax and withholding schedules: the first $20,000 of wages are withheld at 3 percent and wages above that are withheld at 4 percent. 3 In year one, withholding is $1,800, reflecting $600 of withholding on the first $20,000 of wages at 3 percent, plus $1,200 of withholding on the next $30,000, at 4 percent. In year two, wages subject to withholding at 3 percent are still $20,000, but the amount subject to the 4 percent rate rises to $32,500. Total withholding in year two is $1,900. Thus, withholding grew at 5.6 percent, which is faster than the 5 percent wage growth.
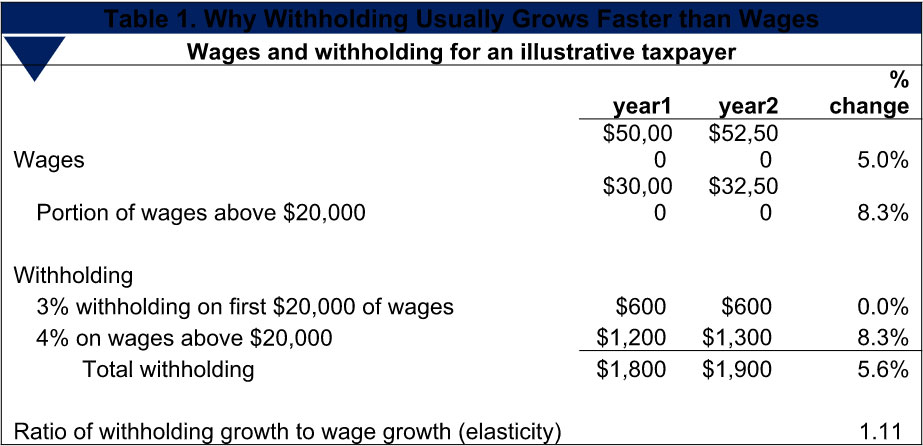
The ratio of the withholding growth rate to the wage growth rate is a useful shorthand measure. In this case, that ratio is 1.11 (5.6 percent divided by 5.0 percent), meaning that withholding growth was 11 percent faster than wage growth. Economists call this ratio an elasticity, and it can be a useful rule of thumb: If the elasticity is 1.11 and stays constant, then if wage growth is 4 percent the forecaster might expect withholding growth of 4.44 percent (1.11 times 4 percent).
State revenue forecasters’ models take these relationships into account: their models and rules of thumb tell them that, ordinarily, withholding will grow faster than wages. We have used our data to estimate the average elasticity of state income tax withholding to wages for the nation as a whole, and we find an elasticity of about 1.10 to 1.12 5 — in recent years, withholding has tended to grow about 10 percent to 12 percent faster than wages.
State forecasters can, in a figurative sense, run their models backwards. 6 If recently reported wage growth has been faster than growth in a state’s withholding tax revenue, that contradicts what the model would have predicted if it had been run backwards (using withholding to predict wages). It would have predicted wage growth that is slower than withholding growth, not faster.
Assuming no obvious explanation such as a cut in income taxes, the forecaster goes into detective mode, looking for possible explanations. Perhaps something changed in the withholding tax system — a change in rules, a change in instructions to employers or workers, or something similar. Or perhaps there was a change in how wage data were reported. Some explanations are easy to investigate quickly, others require time and more data.
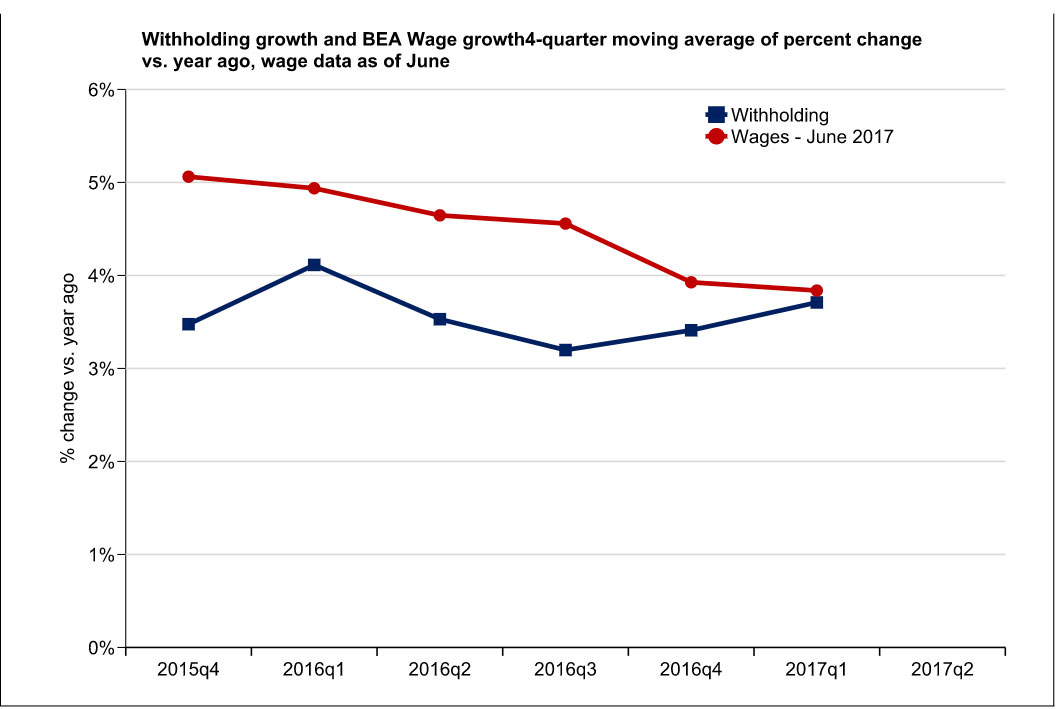
We face similar issues with our withholding tax data for the forty-one states that have broad-based income taxes, if these data tell us something we didn’t expect. We don’t have the in-depth knowledge of tax processing and reporting anomalies that the individual state forecasters have, but we have the advantage of having data for forty-one states. We can see whether there was a national trend, suggesting that something might be going on in the national economy, rather than a state-specific idiosyncrasy. In our mid-July report, “Shortfalls on States’ April Tax Returns: Trump Effect, Weak Economy, or Both?,” we presented a version of Figure 1 below, which shows wage and withholding growth smoothed over four quarters, and noted that in recent quarters withholding has been growing more slowly than wages.… Because most state income taxes are progressive, ordinarily we expect withholding to grow more quickly than wages unless states are cutting taxes. The relatively slower growth of withholding could suggest that wages are not as high as economic data suggest…. 7 We based this on wage data that had been released by BEA in late June.
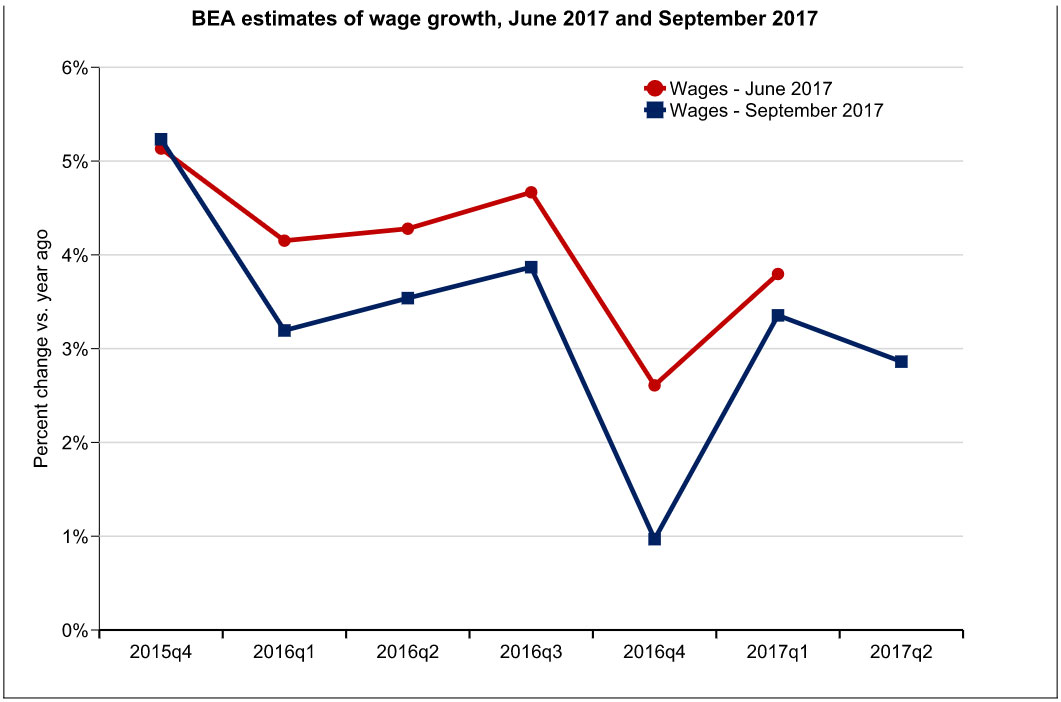
Our suspicions were confirmed in BEA’s July 28th benchmark revision to the National Income and Product Accounts, when it incorporated recent data from the Quarterly Census of Employment and Wages (QCEW), a high-quality and very comprehensive source of data on wages. The result was a significant downward revision to wages. Figure 2 shows year-over- year growth rates in wages in the June release and in the latest release from September. 9 For calendar year 2016 as a whole, wage growth was revised downward by a full percentage point, from 3.9 to 2.9 percent. Thus, it appears that withholding data correctly signaled that BEA wage data had been too high.
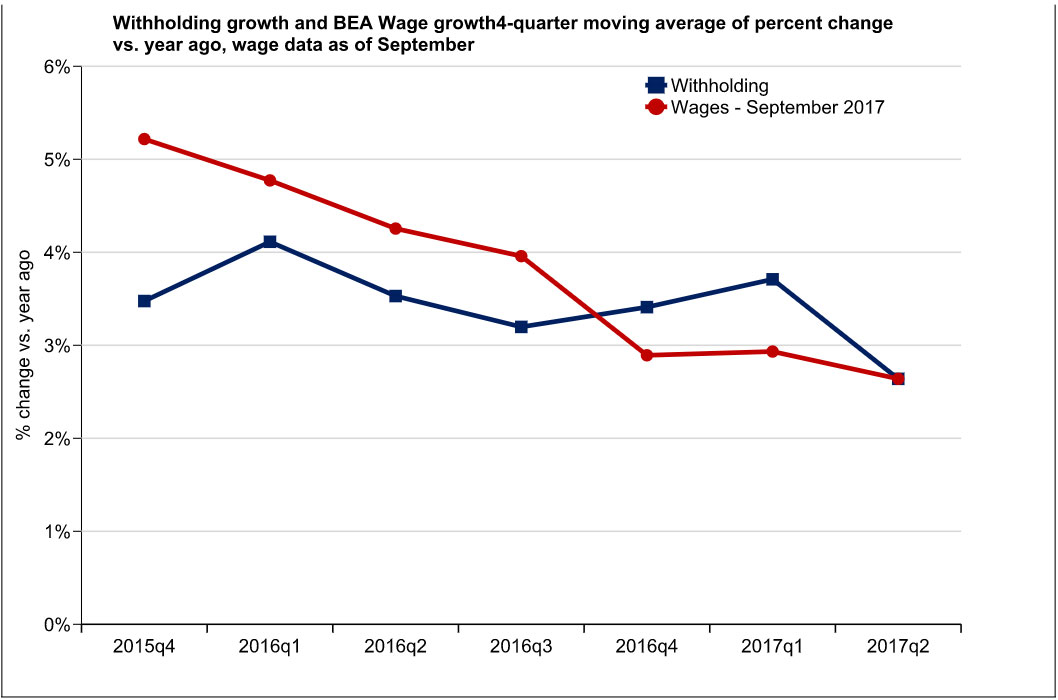
Unfortunately, the mystery is only partly solved. Figure 3 shows year-over- year growth rates of withholding data and the revised wage data, smoothed over four quarters. The data now show that withholding was growing faster than wages in recent quarters, but wages still were growing faster than withholding in earlier quarters, although the gap has narrowed. We will continue to explore this issue.
This was a useful lesson in how tax revenue data can be used to gain insights into what is happening in the economy. This is important not just for state policymakers, who want an accurate read on economic conditions and on how the economy will affect their state’s finances, but for forecasters and economic analysts in the private sector who also need to understand the health of the economy.