
September 19, 2022
The abrupt transition to remote work for many workers at the start of the COVID-19 pandemic led to varying predictions on telework’s lasting impact—from those who declared that downtowns would never be the same, to others who said the experience would merely be a blip on the radar. As usual, the reality lies somewhere in-between the two extremes. Now in the third year of the pandemic, data show that telework has indeed created a semipermanent change in the working habits of many Americans. This policy brief will provide an overview of the data available from the US Census Bureau (as well as select other sources), highlight patterns across demographic groups and regions, and discuss potential policy implications and future topics for exploration.
Prior to the COVID-19 pandemic, regular data on telework habits was largely collected via surveys commissioned by private entities and therefore difficult to quantitatively track over time. But starting in April of 2020, the US Census Bureau launched the Household Pulse Survey, which is intended to measure how the coronavirus pandemic is impacting households across the country from a social and economic perspective. The survey was conducted weekly until late July, then conducted biweekly starting on August 19 and data is updated every few months to inform the work of policymakers and first responders throughout the pandemic. The survey has included questions about telework, that is, working from home or another off-site location, in each survey phase since August 2020.
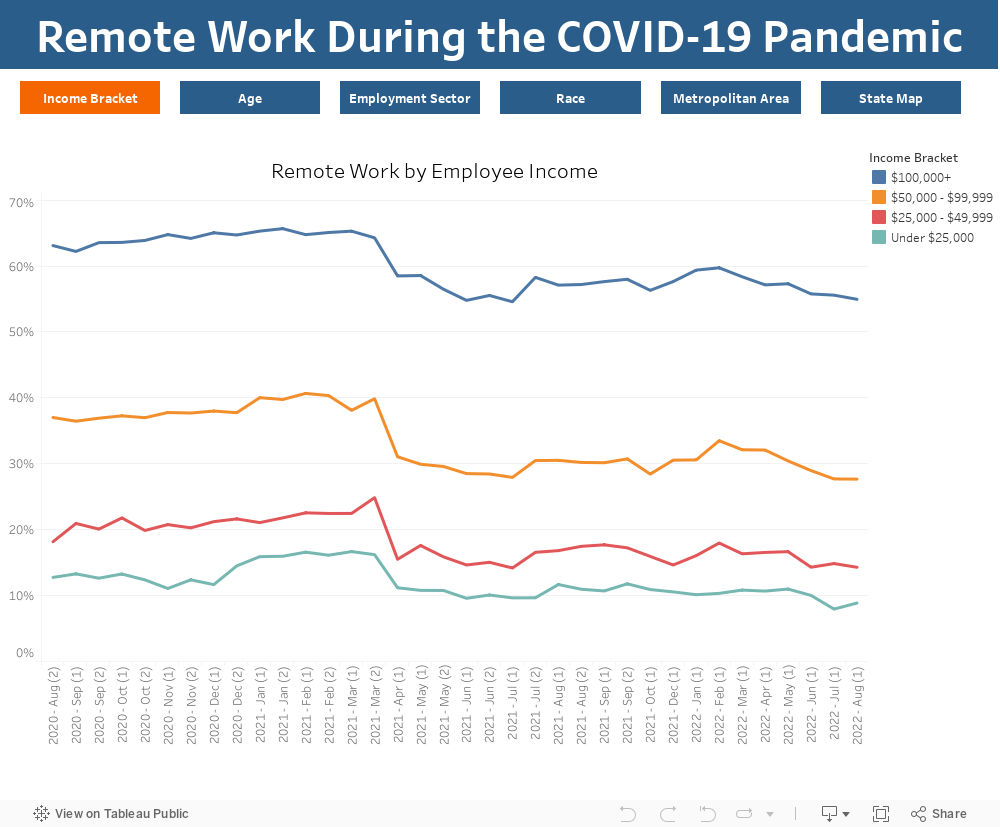
The data from the survey are significant because it is the first time the Census Bureau has tracked remote work with such regularity and they help confirm some of the observations people have made about the economic divide between those who have access to telework and those who do not. Namely, that those in higher-income households have been much more likely to telework than those in lower-income households.
Throughout the pandemic, more than half of US households earning at least $100,000 annually have reported an individual working from home. The share dipped down to 55 percent in early spring of 2021 after consistently hovering around 64 percent, but climbed back up to near 60 percent with the onset of the Delta variant of the coronavirus. Those earning between $50,000 and $99,000 are less likely to report telework. The share of these households reporting teleworking was just below 40 percent in the first year of the pandemic but has averaged 30 percent since May 2022. In fact, the volatility of these two income groups is much greater throughout the pandemic than it is for those earning less. Less than a quarter of households with income below $50,000 reported teleworking. This underscores the broader economic and health equity gaps that the pandemic has served to highlight: that those with means had the option to work from home and shelter themselves from the coronavirus, while those who could least afford to get sick were often on the front lines.
The likelihood of those in higher-income households to work from home also reflects a regional pattern. States in the West and Northeast, where incomes are higher, are home to the highest percentage of teleworking households. Minnesota, where median household incomes top $78,000, was the lone standout in the Midwest with a consistently high percentage of households with an adult working from home. Meanwhile, states in the Southeast, where median household incomes are lower, have some of the lowest share of teleworking households. Mississippi, for example, where median household incomes are the lowest in the country, has consistently reported the lowest or second-lowest rate of telework.
The work-from-home patterns by state are largely influenced by what drives the economy in their major employment centers. Therefore, it’s no surprise that among the largest 15 metropolitan statistical areas, those urban centers with consistently higher rates of people working from home are in the West and Northeast while the South is home to nearly all of the urban centers reporting the lowest telework rates.
Among the largest 15 metropolitan statistical areas, income, pre-pandemic telework, and job type had the strongest and most consistent correlation with telework rates.
Overall, the rate of reported telework generally declined throughout the course of the pandemic. Beginning in August 2020, the 15-city average for households reporting at least one day of telework in a week was 43 percent. The rate peaked in February 2021 at 45 percent and by January 2022 (the last month for which Census telework data is available), it had fallen to 38 percent. Still, this represents a remarkable jump from the pre-pandemic norm. In 2019, the average rate of telework among these 15 cities was 5.6 percent; in 2010, it was 4.6 percent. However, there is wide variation among these cities. Washington, DC’s telework rate climbed to an astounding 61 percent in the winter of 2020-21, while the rate in Riverside, California never rose above 35 percent.
To understand the differences between urban centers and their shifts throughout the pandemic, we considered a range of factors that may influence a worker’s schedule, including: virtual schooling (no correlation found), type of job, transit reliance, and the work-from-home rate prior to the pandemic. Among these 15 metropolitan statistical areas, income, pre-pandemic telework, and job type had the strongest and most consistent correlation. The prevalence of in-person work sectors had the reverse impact.
| Metropolitan Statistical Area | Median Household Income—2019 | Public Transportation—2019 | Share of Employment in In-Person Sectors 2019 | Teleworking 2019 | Telework August 2020—Week 13 | Telework August 2021—Week 35 | Telework August 2022—Week 48 |
|---|---|---|---|---|---|---|---|
| Atlanta, GA | $68,316 | 3.0% | 46.2% | 7.4% | 42.1% | 38.9% | 38.2% |
| Boston, MA | $93,537 | 13.4% | 38.2% | 5.3% | 53.9% | 47.7% | 48.5% |
| Chicago, IL | $71,770 | 12.1% | 46.9% | 5.2% | 43.0% | 41.2% | 35.6% |
| Dallas, TX | $70,281 | 1.4% | 48.6% | 5.8% | 43.2% | 40.5% | 40.6% |
| Detroit, MI | $60,984 | 1.3% | 51.3% | 3.9% | 37.7% | 28.1% | 30.8% |
| Houston, TX | $67,516 | 2.0% | 51.6% | 4.5% | 36.5% | 28.6% | 30.3% |
| Los Angeles, CA | $72,998 | 4.9% | 46.7% | 5.8% | 43.3% | 40.2% | 28.1% |
| Miami, FL | $56,775 | 3.3% | 46.1% | 5.7% | 34.4% | 29.0% | 26.6% |
| New York, NY | $78,773 | 31.9% | 39.1% | 4.5% | 45.2% | 37.1% | 36.6% |
| Philadelphia, PA | $72,343 | 9.5% | 41.3% | 5.2% | 45.4% | 33.7% | 38.4% |
| Phoenix, AZ | $63,883 | 1.9% | 45.6% | 7.0% | 39.7% | 33.2% | 35.0% |
| Riverside, CA | $65,121 | 1.3% | 52.3% | 5.3% | 27.6% | 22.1% | 26.4% |
| San Francisco, CA | $106,025 | 17.6% | 39.1% | 6.6% | 52.5% | 48.0% | 51.1% |
| Seattle, WA | $86,856 | 10.0% | 46.3% | 6.2% | 48.7% | 50.8% | 46.9% |
| Washington, DC | $103,751 | 13.4% | 31.4% | 5.9% | 56.3% | 53.5% | 51.1% |
| National Average | $62,843 | 5.0% | 47.4% | 5.2% | 36.3% | 32.2% | 29.2% |
| Source: 2019 ACS Five-Year Estimates and Household Pulse survey. |
Telework by Sector
The availability of telework varies greatly by sector. The Bureau of Labor Statistics conducted the Business Response Survey to the Coronavirus Pandemic to assess how employers responded to the COVID-19 pandemic. They published data on telework patterns by industry. We classified sectors as in-person when more than two-thirds of employees rarely or never teleworked. The following lists the sectors classified as in-person and telework-eligible and the share of employees who rarely or never teleworked.
In-person: agriculture (94.3 percent), retail trade (93.1 percent), construction (90.8 percent), transportation (89.1 percent), manufacturing (87.6 percent), arts (85.9 percent), and wholesale trade (73.5 percent)
Potentially telework eligible: educational services (63.7 percent), finance and insurance (54.9 percent), professional, scientific and management (53.7 percent), and information (32.0 percent).
In other words, the existence of a pre-pandemic remote work culture means that during the pandemic, people were more likely to telework. Urban areas with higher median incomes, a lower percentage of sectors requiring in-person work, and/or a higher rate or telework in 2019 are more likely in 2022 to have a higher-than-average share of commuters reporting telework.
For other factors, the relationship with telework shifted during the past two years. High public transit reliance was a more significant factor in 2020, but that correlation fell as the pandemic wore on. A potential explanation is that reliance on public transit is essentially a byproduct of the more significant factors that do contribute to telework. Certainly, in 2020, many former riders avoided public transportation when possible out of public health concerns. But in the larger context, cities that are dominated by white-collar professional office jobs look fundamentally different than cities with higher levels of employment in manufacturing or agriculture. Urban centers that rely on office jobs tend to have a higher population density and, as a result, workers rely more heavily on public transportation. Cities with more in-person jobs such as those in the manufacturing sector have workplaces that require more land and thus have a lower density and commuters who rely less on public transportation.
Conversely, the rate of telework prior to the pandemic in a given urban area was not a significant factor in those early months but by 2022 did show a positive correlation with telework. This shift suggests that, while emergency health measures and business closures were driving trends in 2020, urban centers are now moving back in the direction of their pre-pandemic patterns (as also evidenced by the data above) although overall higher rates of telework are likely to persist.
This shift also coincides with the timeline for when vaccines were made widely available to the general population (May 2021). On the national level, there is an overall decline in reported telework: Prior to April 2021, an average of 37 percent of households reported telework; since that month the average share has been 31 percent. Among the 15 largest metros that has also been the case; the average rate of telework has gone from the mid-40s to about 38 percent since April 2021.
In other words, the existence of a pre-pandemic remote work culture means that during the pandemic, people were more likely to telework. Urban areas with higher median incomes, a lower percentage of sectors requiring in-person work, and/or a higher rate or telework in 2019 are more likely in 2022 to have a higher-than-average share of commuters reporting telework.
One issue clouding this particular time period, however, is that the Household Pulse Survey question on telework changed slightly during this time. In April 2021, it went from asking if the pandemic caused anyone in the household to replace their regular in-person work with telework to simply asking if anyone in the household had teleworked at any time during the prior seven days. While the downward shift in telework occurrence came at a time when public health restrictions eased, vaccines were becoming widely available, and many employers were considering “back to the office” plans, it does mean that the early data on telework isn’t necessarily a one-for-one comparison to the later data.
Still, when taken together with other data sources, this information contributes to the notion that telework will remain a permanent part of the weekly rotation for many office workers.
No single factor represents a silver bullet for determining the future of telework trends in any given urban area or state. Rather, the way in which these factors overlap or build upon each other—in the context of each urban center’s economy—is what appears to be driving the telework trends in any given region.
For example, the median household income of nearly $82,000 in the New York metropolitan area is roughly $10,000 higher than in Dallas-Fort Worth, but since April 2021, the two urban centers have had increasingly similar work-from-home rates. By January 2022, the rates were nearly identical (40 percent in Dallas and 39 percent in New York). Phoenix, Arizona, and Riverside, California, have nearly identical household incomes, but Phoenix’s 39 percent rate of reported telework in January 2022 is nearly twice as high as Riverside’s. Even the prevalence of in-person work sectors isn’t a single determinate. Atlanta, Miami, Los Angeles, Phoenix, and Seattle all have between 35 and 37 percent of households reporting an in-person work sector. But the difference, or spread, in telework rates among these cities since April 2021 has ranged from 7 to 11 percentage points.
When viewed more holistically, a pattern does emerge. While 10 out of the 15 metro areas studied had high rates of telework (greater than 40 percent) in August 2020, nearly two years later only five (Boston, Dallas, San Francisco, Seattle, and Washington, DC) still report telework rates above 40 percent. All five of those metro areas have higher-than-average numbers in at least two of the three characteristics that favor telework: higher income, higher pre-pandemic telework rate, lower share of in-person workers. All five have also recorded the largest percentage point jumps from their pre-pandemic telework rates.
The New York metropolitan area is the only other region of the top 15 that also scores higher in two of the three telework characteristics. While the region had slightly higher than average telework rates during the first year of the pandemic, it has settled in-line with the 15-city average rate since April 2021. The region continues to get a lot of attention regarding remote work because of the sheer volume of workers—the metropolitan area has more than 9 million workers, many of whom commuted long distances and nearly one-third of them were regular public transit commuters. Still, it’s not immediately clear what other factors might have contributed to this slight telework shift in New York. The next section considers a few possible elements that may impact telework decision-making in the New York region and elsewhere.
States and localities had different public health responses to the pandemic when it came to stay-at-home orders, business shutdowns (such as mandated mall or movie theater closures), remote schooling, and other capacity restrictions on public gatherings throughout the pandemic. The impact of these responses may also have played a part early on in the pandemic when it came to the differences in telework in areas where a lower percentage of people are working in in-person sectors. While business shutdowns primarily affected retail and service industry workers who are not eligible to work from home, the increased social restrictions for others may have influenced decision-making for those who did have the ability to telework and also prompted telework mandates by employers.
This underscores the broader economic and health equity gaps that the pandemic has served to highlight: that those with means had the option to work from home and shelter themselves from the coronavirus, while those who could least afford to get sick were often on the front lines.
The New York area in particular received a lot of media attention both as one of the early epicenters of the coronavirus spread and also for the stark images of empty city streets and shuttered subway stations in the “city that never sleeps.” By the spring of 2021, when cities and states were embarking upon their full reopening plans—or well into them—there was arguably even more pressure on New York City area officials to demonstrate that the region was still the economic capital of the country. In fact, former Mayor Bill de Blasio declared at the time, “This is going to be the summer of New York City” and that “people are going to flock here from all over the country to be part of this amazing moment.” Companies—real estate in particular—also responded and by the end of that summer, a Partnership for New York City survey found one-quarter required workers to be in the office full-time.
Another potential contribution to the New York region’s evening out (at least in these pandemic era terms), is that most of the telework impact has centered on Manhattan but the rest of the region may not have seen as significant an impact. Data from the security firm Kastle Systems, which tracks larger office buildings usually located in downtown cores, supports this notion: in 2021, New York’s office occupancy continued to track well below the firm’s 10-city average (which ranged from 21 percent to 37 percent that year). Relocations out of the downtown core, but still within the metro area, are also another potential factor. A recent New York Times article explains why Brooklyn has become a popular destination for Manhattan-based companies and notes that more than 1.5 million square feet of office space is under construction in the borough.
Elsewhere, policy responses to increased COVID-19 transmission rates also seem to have influenced telework rates to a degree. For example, Los Angeles and Miami have a similar share of employment in sectors requiring in-person work. Both also had higher than average levels of pre-pandemic telework. But in the pandemic, the difference in the rate of telework between the two cities has been, at times, dramatic. Survey data from August 2020 shows that 43 percent of workers reported telework in Los Angeles, while 34 percent did in Miami. At that time, the Los Angeles area was experiencing a surge of coronavirus cases related to the Delta variant and officials shut down many public places and retail establishments in response. Miami had imposed a curfew on businesses but did not shut them down.
Dallas has an even higher share of in-person workers who make up about 40 percent of the area’s workforce. But in August 2020, the state of Texas was still under a partial lockdown with bars ordered closed and other retail at 50 percent capacity, and the city’s telework rate was identical to the rate in Los Angeles. By September 2021, when all three places had fully reopened, cases were lower and vaccines widely available, Miami and Dallas had similar telework rates of 33 percent while Los Angeles’ was only slightly higher (35 percent).
Looking at the patterns so far, metro areas with a higher share of higher-income office workers and a pre-pandemic culture of remote work are likely to see these higher levels of teleworking persist. One important question the Household Pulse Survey doesn’t answer is how often adults are teleworking each week. This datapoint is of particular significance to regional planners as they consider everything from traffic signals to urban housing in figuring a region’s new mobility patterns.
Multiple surveys have shown that most people prefer a hybrid schedule, with some days in the office and others at home. One way to understand how this is playing out is by looking at Google Community Mobility data on time spent at workplaces. Most of the states with the biggest drops in total workplace time are also home to the nation’s most sprawling metro areas. But notably, the 2022 reports show so far that time spent at work is down an average of 10 percent, with Western and Northeast states that are home to large metros (California and New York, for example) trending in the higher teens. Texas’ data is slightly below the national average (9 percent less time in the office). This positioning both aligns generally with the reported rates of telework among the major urban areas in these states, but it also tells us that workers are, indeed, going to the office. It is just with less frequency than prior to the pandemic.
Nevertheless, two-plus years of data during the pandemic point to the fact that for office workers, hybrid work schedules are becoming the norm. How much this shift affects the daytime populations of urban centers will vary from city to city, depending on their main industries, incomes, and (to some extent) their pre-pandemic telework culture.
The data from Google also give us another level of detail when it comes to decision-making around telework during different waves of the coronavirus and how that has changed. For example, in January 2021, when the spread of the Delta variant was at its peak, Census data show that 61 percent of workers in Washington, DC, reported teleworking. The Google mobility data for that same month shows that time in the office was down 52 percent. A year later when the highly transmissible Omicron variant peaked in January 2022, Census data says that 49 percent of DC-area workers reported teleworking and time in the office was down 46 percent, according to Google. This would seem to indicate that as time goes on, pandemic-related disruptions could have less of an impact on how often workers do go to the office.
Nevertheless, two-plus years of data during the pandemic points to the fact that for office workers, hybrid work schedules are becoming the norm. How much this shift affects the daytime populations of urban centers will vary from city to city, depending on their main industries, incomes, and (to some extent) their pre-pandemic telework culture.
This day-to-day movement of residents is a local policy issue affecting transit, public services, housing, and consumer spending in metropolitan regions. All of these factors contribute to city revenues and expenditures. A study published by the Instituto Tecnológico Autónomo de México, Stanford University, and the University of Chicago Booth School of Business estimated that one-in-five working days will now be done at home, which could lower consumer spending in city centers by as much as 10 percent annually.
It’s no wonder then that some local officials like New York City Mayor Eric Adams have pushed firms to get workers back into offices. And while telework time has declined—particularly over the past year—it’s a new reality that metropolitan areas will be adjusting to for years to come. In some cases, city leaders will need to consider the fact that their downtown cores won’t be supporting as many workers as they did before the pandemic. Instead, it’s an opportunity to think about potential other ways that downtown real estate can contribute to economic growth. Howard Chernick, professor emeritus at Hunter College and the Graduate Center, City University of New York, is studying the pandemic’s fiscal impact on eight major cities and his research shows that more than one-third of property tax revenues come from their commercial assets. In Atlanta, it’s as high as half of property tax revenue; in Boston it’s as low as 25 percent. A hit to those property values could lower tax revenue without growth elsewhere.
State policymakers have a role to play as well both in ensuring that their current job centers can thrive in a more flexible worker environment but also from an economic development and growth perspective. Given that most teleworkers are higher earners, the potential income tax revenue from remote workers moving from other states may be appealing. States with stagnant or declining populations are viewing remote work as an opportunity to grow their tax base. West Virginia, for one, launched Ascend West Virginia, a moving incentive program that came with $12,000 for those applicants who were selected. An astounding 7,500 people applied to the program, according to the state, and 53 were selected hailing from as far away as Berlin, Germany. The average annual income of those selected was approximately $105,000—nearly four times the state’s average per capita income and more than twice the median household income.
In fact, West Virginia, along with Vermont, Maine, and New Hampshire, all saw a pandemic boost to their populations, according to Fitch Ratings analyst Olu Sona. But without a larger shift in these states’ economic prospects, he said they are likely to revert to their pre-pandemic historical trend of very low to negative population growth.
“Some places that didn’t typically attract people all of a sudden saw a bump as the pandemic caused a lot of people to reevaluate their priorities,” he said. “But when you think about the fundamental reasons people move, the number one reason tends to be an economic one. So if a place was struggling with that to begin with, you’re unlikely to see that influx on a consistent basis.”
Even as states and cities have relaxed pandemic restrictions and companies have reopened offices, remote work has remained a staple over the last two years for office workers. While the rates have fluctuated with waves of the coronavirus, governments, companies, and organizations have invested billions of dollars in remote technologies and aren’t likely to lock that all back up and throw away the key. Remote work appears neither to be a catch-all solution for states struggling to lure workers, nor a fad for city centers to ignore.
As state and local leaders enact policies and invest dollars in shaping their economies to meet the needs of today’s workers, the need to adapt and respond to telework trends will vary from region to region. Policymakers should keep in mind the different demographic factors that contribute to higher rates of telework—in the context of their own economies—as they chart their post-pandemic recoveries, determine how to invest American Rescue Plan funding, and strategize the best use of funding from the Infrastructure Investment and Jobs Act.