
April 19, 2022
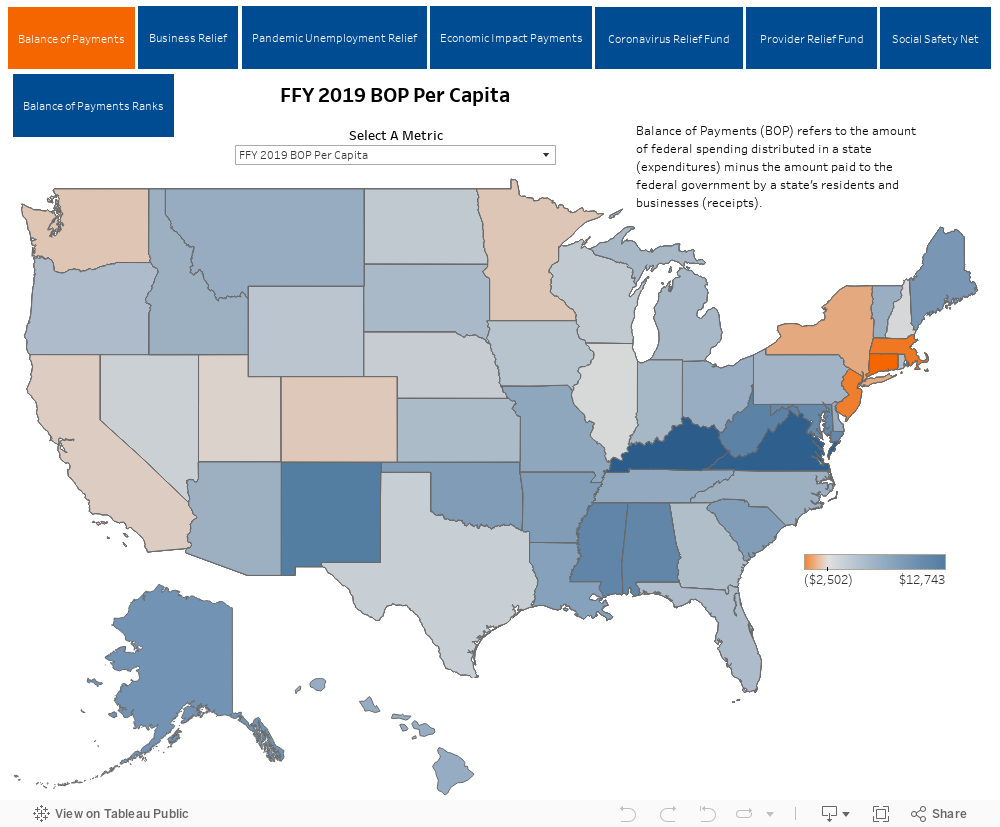
COVID-19 dramatically disrupted the fiscal balance between the states and the Federal government. In more conventional years, states with a large number of high-income residents such as New York, California, New Jersey, and Illinois pay more in taxes than they receive in Federal spending making them net donor states. The Rockefeller Institute’s Balance of Payments report[1] shows that Federal Fiscal Year (FFY) 2020 was, however, far from a conventional fiscal year.[2] Federal spending increased from $4.4 trillion in FFY 2019 to $6.6 trillion, an increase of 47.3 percent. This was driven by funding allocated to directly address the COVID-19 public health crisis and economic fallout. In addition to this new funding, there were historic levels in spending in preexisting social safety net programs such as unemployment compensation and Medicare. As a result, the Federal government spent $8,801 more per person than it received in receipts. This represents a significant increase in the per capita balance of payments, which had grown from $1,304 in FFY 2015 to $2,394 in FFY 2019.
For the first time since the Rockefeller Institute began conducting this analysis in 2017 (for FFY 2015), there were no donor states in this year’s Balance of Payments report. There was also a reshuffling of relative rankings. Much of the COVID-19 relief funding was distributed to individuals meaning that states with larger populations received more assistance. These larger states, including those with a greater concentration of high-income residents, therefore jumped up in their rankings. California moved from 47th in 2019 to 1st, New York rose from 50th to 5th, Massachusetts jumped from 48th to 21st, and New Jersey went from 49th to 22nd. Likewise, as COVID-19 relief funds were distributed on a per capita basis, states with smaller populations saw their relative position fall. Alaska’s rank dropped from 28th to 42nd, Delaware from 32nd to 45th, and South Dakota from 34th to 47th.
In this data brief, we do a deeper dive into exactly how COVID-19 relief spending was distributed, explore the impact of COVID-19 on social safety net spending, and demonstrate how this historical increase in spending impacted states’ balance of payments with the Federal government.
Spending Breakdown
In the first federal fiscal year (October 1, 2019-September 30, 2020) of the pandemic, Congress enacted four laws appropriating a total of $2.59 trillion in additional budgetary resources to be spent in the coming years.[3] Over the course of FFY 2020, the Federal government is estimated to have obligated more than $1.5 trillion of these funds. Programs provided funds to individuals, businesses, healthcare providers, higher education institutions, and state and local governments in an effort to address the COVID-19 public health crisis and lessen the economic fallout. These programs include the Paycheck Protection Program for small businesses,[4] Economic Impact Payments for households,[5] and the Coronavirus Relief Fund for state and local governments.[6] When tallying the balance of payments, the spending for these programs were accounted for in a separate COVID-19 relief spending category.
COVID-19 also resulted in higher-than-average expenditures for existing programs. The dramatic number of job losses resulted in a record-breaking number of claims filed for unemployment insurance. The increases in Medicare reimbursement rates resulted in higher-than-normal expenditures for the program. The growth in expenditures in these programs can be attributed to the pandemic, but the portion of spending attributed to COVID-19 response can be difficult to isolate and was treated separately from COVID-19 relief spending.
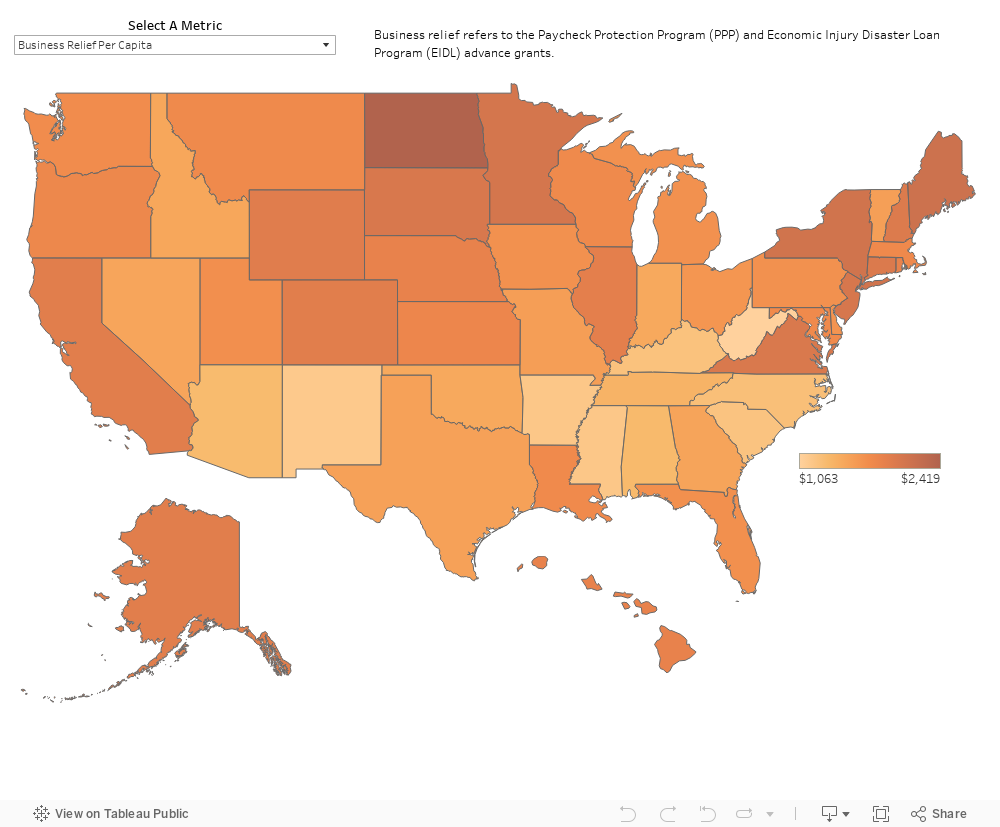
In FFY 2020, the Small Business Administration (SBA) granted $525 billion in loans to businesses across the United States through the Paycheck Protection Program (PPP).[7] Borrowers could use these loans to make payments for operating expenses such as payroll, rent/mortgage, utility, and other ordinary business expenses. Borrowers that used the loans to maintain employee and compensation levels and fund payroll costs were eligible for loan forgiveness that essentially turned the funds from loans to direct payments.[8]
The SBA’s Economic Injury Disaster Loan Program (EIDL) facilitated an additional $191.2 billion in loans to businesses impacted by the pandemic in FFY 2020.[9] Businesses could borrow up to six months of working capital at a low fixed interest rate. These funds were allowed to cover a wider range of expenses than the PPP program. Because these funds were loans, and the money must be paid back, they were not included in the balance of payments calculation. In an extension of the EIDL program, the SBA distributed targeted EIDL advance grants of $10,000 and supplemental advances of $5,000 for small businesses in low-income communities that suffered an economic loss of 50 percent or greater.[10] Because businesses were not obligated to pay back the EIDL advance grants, the funds were included as COVID-19 relief spending.
| Top 10 | ||
| 1 | North Dakota | $2,419 |
| 2 | Massachusetts | $2,157 |
| 3 | New York | $2,118 |
| 4 | Minnesota | $2,079 |
| 5 | New Jersey | $2,052 |
| 6 | South Dakota | $2,036 |
| 7 | Vermont | $2,013 |
| 8 | Connecticut | $1,999 |
| 9 | New Hampshire | $1,981 |
| 10 | Wyoming | $1,950 |
| Bottom 10 | ||
| 41 | Tennessee | $1,388 |
| 42 | Alabama | $1,333 |
| 43 | Arizona | $1,318 |
| 44 | North Carolina | $1,271 |
| 45 | Kentucky | $1,243 |
| 46 | South Carolina | $1,227 |
| 47 | Mississippi | $1,185 |
| 48 | Arkansas | $1,183 |
| 49 | New Mexico | $1,159 |
| 50 | West Virginia | $1,063 |
When comparing the total dollar values of funds distributed to the states, the four most populous states received $201 billion or 35.3 percent of the spending in these programs. Table 1 presents the per capita spending for the 10 states that received the most and least funding. The SBA distributed $1,702 per resident through the two programs combined. North Dakota received more funding per capita than any other state; securing $717 more per person than the national average. North Dakota’s success in securing PPP loans was driven by client outreach efforts coordinated by the Bank of North Dakota.[11] Businesses in northeastern states, including Massachusetts, New York, New Jersey, Vermont, Connecticut, and New Hampshire, were successful in securing funds. States in the southeast, Tennessee, Alabama, North Carolina, Kentucky, South Carolina, Mississippi, Arkansas, and West Virginia, received less per person than the national average.
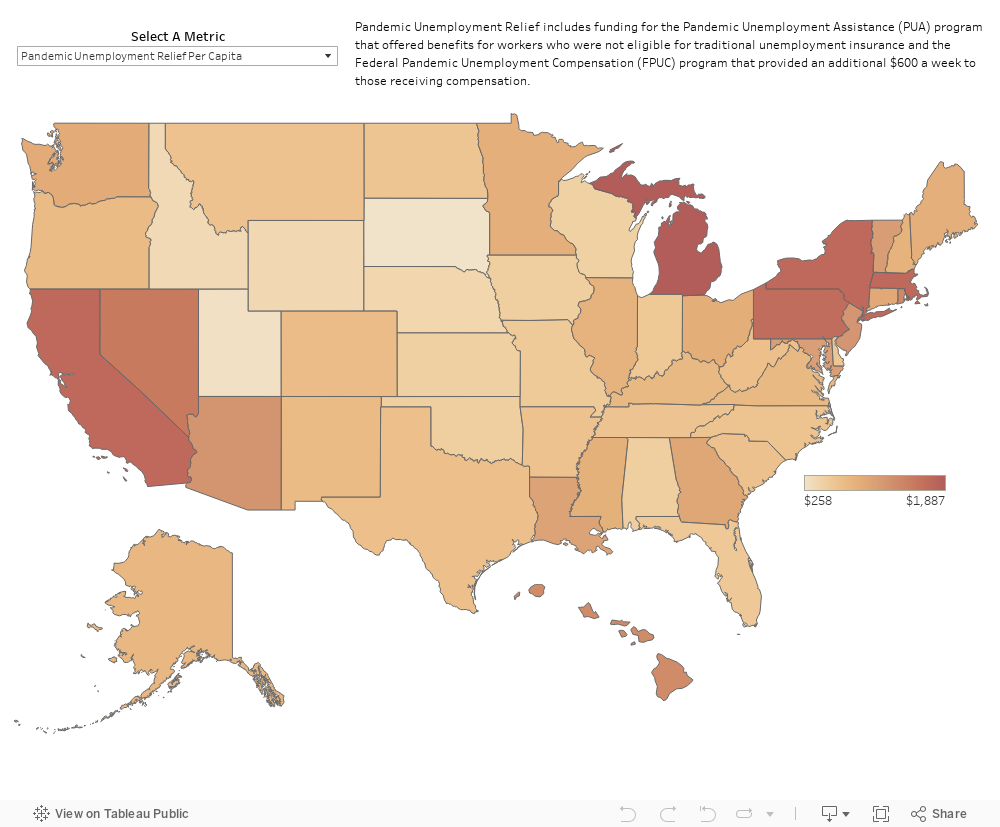
Shutdowns brought commerce to a halt in the spring of 2020. As businesses shuttered, the US saw unemployment rates reach unprecedented levels at record speed. Many workers were eligible for regular unemployment insurance payments made through their state’s trust funds and unemployment offices. In addition, the Federal government established two programs to expand the number of individuals eligible for unemployment compensation and increased the level of funding for which individuals were eligible.
The Pandemic Unemployment Assistance (PUA) program offered benefits for workers who were not eligible for traditional unemployment compensation because they were not covered by unemployment insurance.[12] This included individuals who were self-employed, contractors, gig workers, etc., and those who did not have a long enough work history. The program provided 39 weeks of benefits. The Federal Pandemic Unemployment Compensation (FPUC) program, provided an additional $600 a week to individuals collecting regular unemployment compensation.[13] The total expenditures for the two programs was $344.4 billion.
| Top 10 States | |||
| Unemployment Rate (2020) | Unemployment Rank | Per Capita | |
| Michigan | 10.0 | 47 | $1,887 |
| California | 10.2 | 48 | $1,719 |
| New York | 9.9 | 46 | $1,718 |
| Massachusetts | 9.4 | 44 | $1,716 |
| Pennsylvania | 9.1 | 41 | $1,669 |
| Nevada | 13.5 | 50 | $1,531 |
| Rhode Island | 9.2 | 43 | $1,356 |
| Hawaii | 12.0 | 49 | $1,327 |
| Arizona | 7.7 | 31 | $1,220 |
| New Jersey | 9.5 | 45 | $1,194 |
| Bottom 10 States | |||
| Unemployment Rate (2020) | Unemployment Rank | Per Capita | |
| Iowa | 5.1 | 6 | $506 |
| Alabama | 6.5 | 21 | $503 |
| Oklahoma | 6.2 | 16 | $500 |
| Kansas | 5.7 | 9 | $482 |
| Wisconsin | 6.3 | 18 | $468 |
| Nebraska | 4.1 | 1 | $405 |
| Wyoming | 5.8 | 11 | $387 |
| Idaho | 5.5 | 7 | $369 |
| Utah | 4.7 | 3 | $295 |
| South Dakota | 4.3 | 2 | $258 |
The distribution of these unemployment funds was concentrated in a handful of states. One-fifth of the funds were directed to California, which received $68.0 billion, and an additional 10 percent went to New York, which received $34.7 billion. The top five states collected nearly half of the unemployment funding allocated in FFY 2020.
Michigan received the most per capita COVID-19 pandemic unemployment relief of any state. At $1,887 per resident, the state received more than seven times as much per person than the state with the least funding: South Dakota. The 10 states receiving the highest levels of per capita unemployment support included nine states ranking among the 10 with the highest levels of unemployment in 2020. The states receiving the lowest levels of per capita support had workforces significantly less impacted by unemployment. South Dakota received only 1/7 of Michigan’s per capita payments and it had an unemployment rate that was less than half of the Great Lakes state.
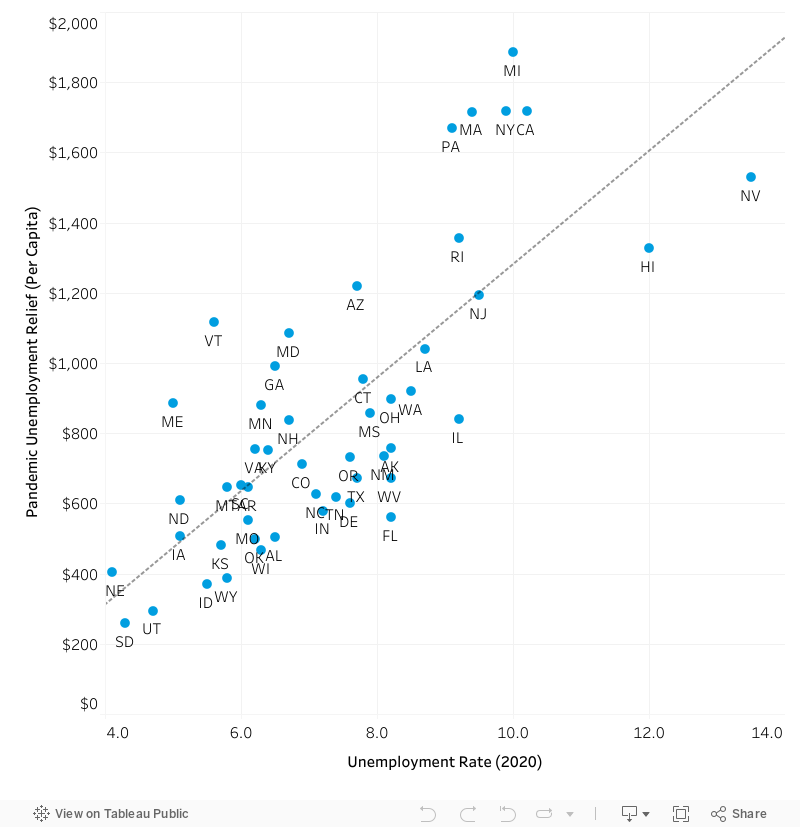
The figure below shows the relationship between the status of the state’s labor market and the funding received through the pandemic unemployment funding programs. States with lower levels of unemployment had fewer residents qualify for unemployment compensation and therefore received less funding on a total and per capita basis.
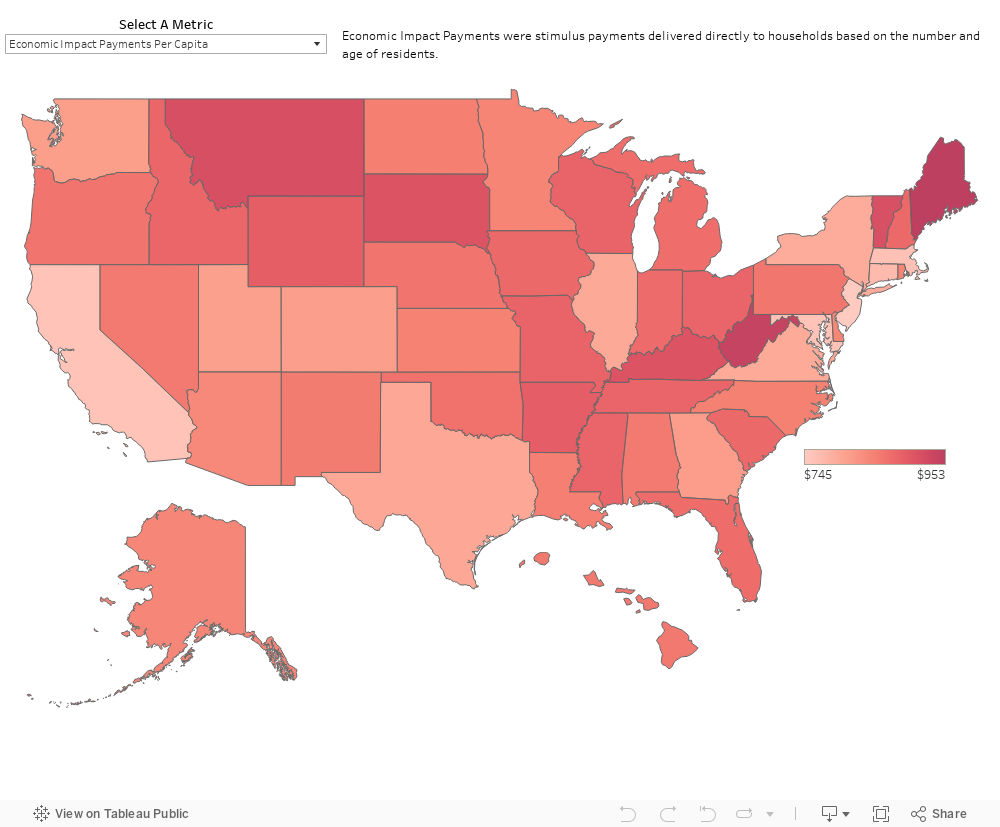
In 2020, the CARES Act approved the first of three Economic Impact Payments distributed by the IRS to the majority of households in the United States.[14] The first round of payments hit bank accounts in April of 2020. These payments were equal to $1,200 per adult and $500 for each child but were phased out for individuals and married couples with adjusted gross incomes above $75,000 and $150,000, respectively. Subsequent payments were distributed in FFY 2021 (December 2020 and March 2021) and are not part of this year’s analysis.
In total, the Federal government distributed $275.4 billion in direct payments to households or an average of $819 per resident. Because the payments were essentially allocated on a per capita basis, the states with the largest populations received the most total stimulus funding. California, Texas, Florida, New York, and Pennsylvania received 36.2 percent of the funds distribute across the states.
The per capita distribution did not deviate much from the national average of $819. The state that received the least per resident (New Jersey, $745) still had an average payment only 9 percent below the national average and the state with residents with the highest average payment (Maine, $953) received only 16 percent more than the national average. Two factors contributed to a states’ per capita distribution: average age of residents and the average income. When explored on a per capita basis, Maine, West Virginia, Montana, Vermont, and Kentucky all fared well. These states have populations with higher median ages, so more residents received $1,200 rather than the $500. They also have fewer residents that exceeded the income requirements. New Jersey, California, Maryland, Connecticut, and New York received less per person. This was driven by the higher level of incomes in these states. High income states had more residents living in households that exceeded the maximum adjusted gross income and therefore did not receive payments.
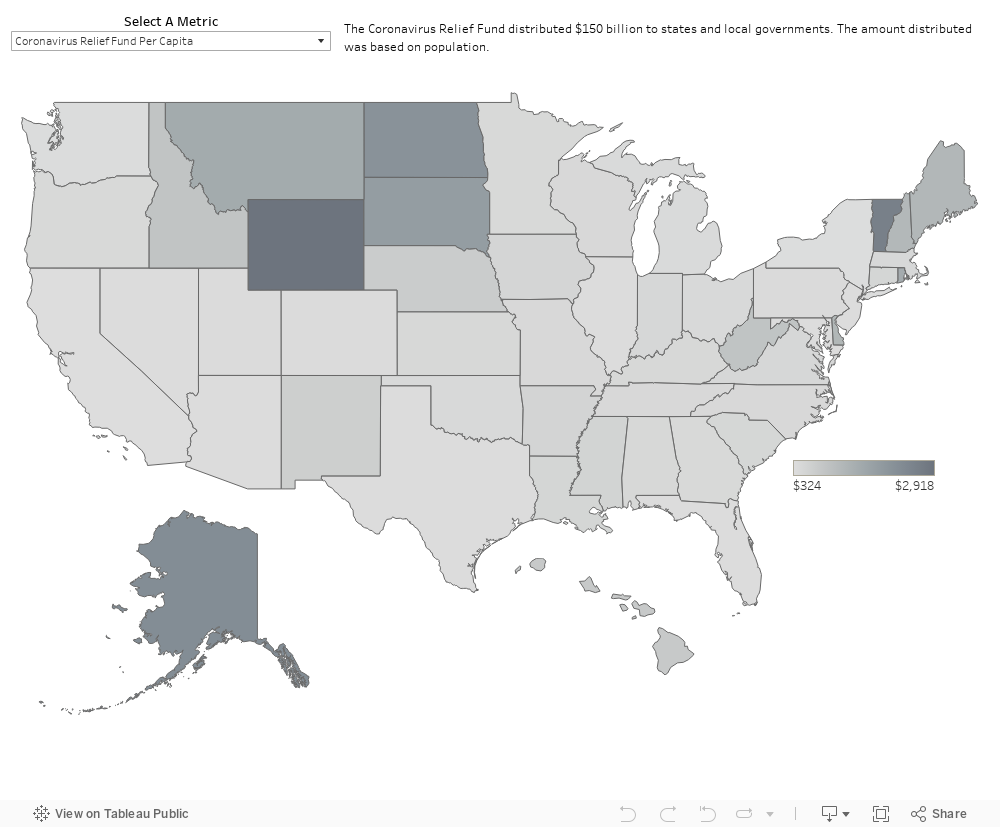
The Coronavirus Relief Fund, which was established in the CARES Act, distributed $150 billion to states and local governments with populations greater than 500,000, US territories, and tribal governments.[15] Funding could be used to finance expenditures to address the public health emergency. It was not allowed to be used to offset lost revenues or unrelated expenses.
The amount distributed was scaled based on population but each state received at least $1.25 billion. The means California, Texas, Florida, New York, and Pennsylvania received the largest allocations because they had the highest populations. Per capita calculations favored the least populous states with Wyoming, Vermont, Alaska, and North Dakota, all receiving more than $2,000 per resident. The state of Wyoming received 8.5 times as much funding per resident than the most populous states.
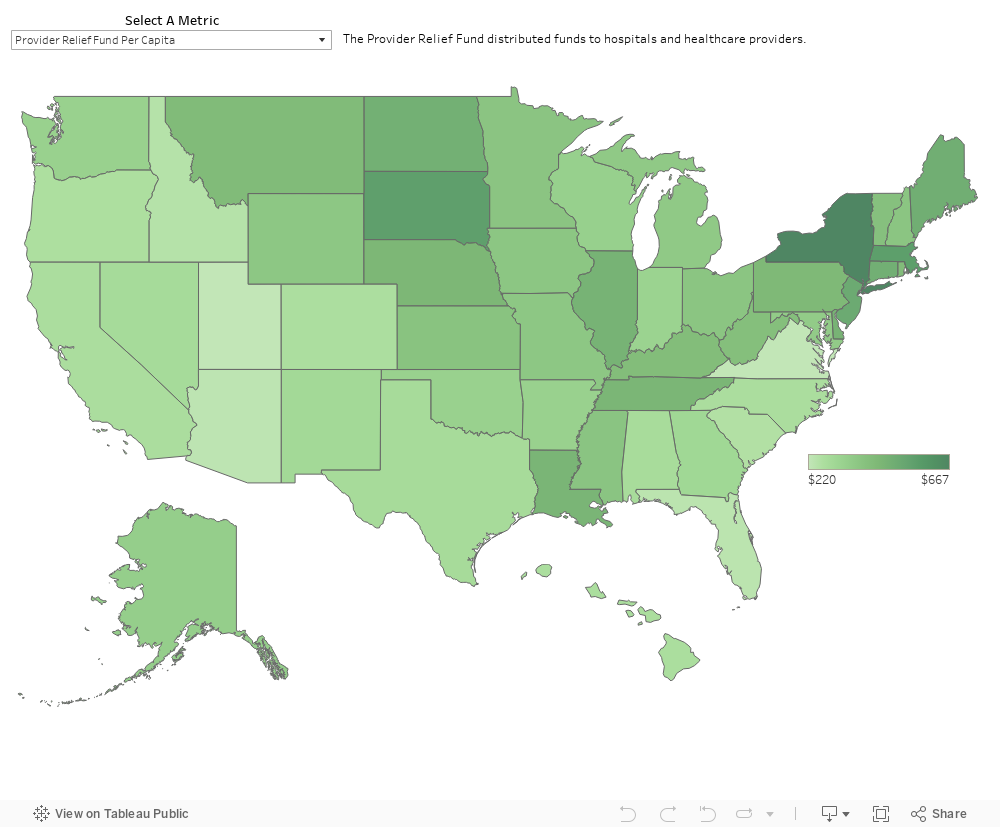
The CARES Act (PL 116-136)[16] and the subsequent Paycheck Projection and Health Care Enhancement Act (PL 116-139),[17] provided $175 billion in relief funds for hospitals and healthcare providers through the Provider Relief Fund. In order to quickly distribute these funds, $50 billion ($30 billion in CARES and $20 billion in the Health Care Enhancement Act) in funds were distributed to healthcare providers based on their Medicare reimbursements in 2018. In order to receive the funds, healthcare providers were required to attest to payments and agree to terms and conditions. Subsequent allocations were targeted to high-impact areas, rural providers, those serving the uninsured, and providers who only take Medicaid clients.
New York received the highest levels of funding from the Provider Relief Fund on a total and per capita basis. New York and other northeastern cities were the epicenter of the COVID-19 outbreak over spring 2020. A portion of the provider funds were targeted to high impact areas meaning that New York providers would have received a larger share of the funds. Nationally, HHS distributed $335 per person and New York received $667 per capita, almost twice the national average. As with the other relief, the largest total amounts went to states with higher population levels. The states that received the next highest levels of per capita funding were Massachusetts, South Dakota, and New Jersey. Like New York, the neighboring states experienced surges in the spring of 2020. South Dakota experienced a surge in cases starting in late summer 2020.
Beyond the targeted COVID-19 relief spending, the pandemic triggered spending within the nation’s countercyclical safety net programs. Greater spending is generally expected within these programs during an economic downturn. Since safety net programs, including unemployment insurance benefits, Medicare, and food assistance, tend to take the form of direct payments to individuals, disbursements tend to be highly correlated with state population. Table 3 shows the levels of FFY 2020 spending projected by the Office of Management and Budget (OMB) when they published the President’s 2021 Budget in February 2020.[18] These numbers represent OMB’s best estimates made the month before the pandemic arrived in the US. The table compares the projections with actual spending values published in the President’s 2022 Budget (May 2021).[19] The table identifies $185 billion in direct payments spending that was unforeseen in February 2020. Over the previous three years, projections for these three programs were generally within 10 percent of actual spending. We assume that the overwhelming proportion of OMB’s prediction error is due to program spending triggered as a result of the pandemic.
| Projected ($ millions, as of February 2020) | Actual ($ millions, as of May 2021) | Difference ($ millions) | |
| Expenditures | 4,454,935 | 6,550,396 | 2,095,461 |
| COVID Relief Spending | – | 1,802,985 | 1,802,985 |
| Remainder | 4,454,935 | 4,747,411 | 292,476 |
| Direct Payments | 2,766,981 | 2,953,575 | 186,594 |
| State Unemployment Insurance | 27,814 | 127,609 | 99,795 |
| Medicare | 823,986 | 895,959 | 71,973 |
| Food Assistance (SNAP) | 58,605 | 77,629 | 19,024 |
| Grants | 790,732 | 799,290 | 8,558 |
| Contracts | 598,365 | 641,495 | 43,130 |
| Health and Human Services | 27,333 | 40,785 | 13,452 |
| USDA | 15,976 | 30,064 | 14,088 |
| Wages | 289,697 | 290,945 | 1,248 |
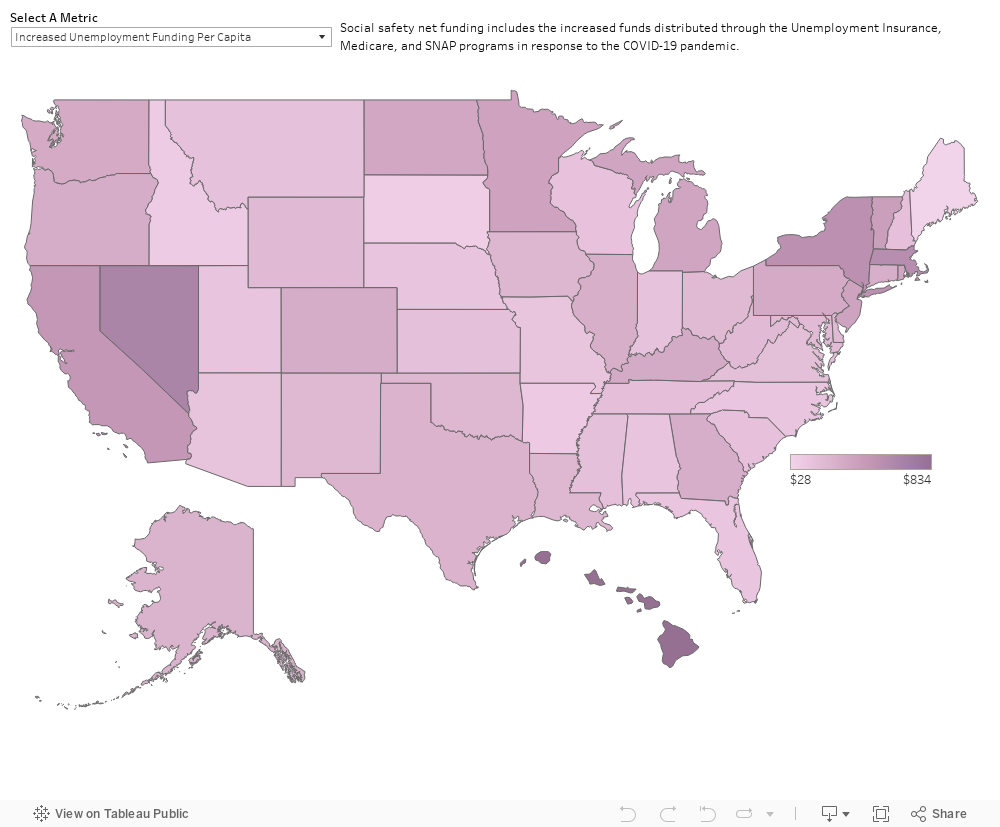
Federal spending on unemployment insurance (UI) exceeded original projections by $100 billion dollars. In addition to the increased spending, there was shifting of which states received funds when compared with 2019 allocations by nearly $100. For example, New York’s share of Federal unemployment spending grew from 7.4 percent to 10.2 percent. New York’s shift was the largest of any state though Georgia (1.1% to 2.8%) and Florida (1.2% to 2.5%) also saw their share shift upward by over a percentage point. On the other hand, New Jersey (7.2% to 4.4%), Illinois (6.3 to 4.4%), and Pennsylvania (6.5% to 4.8%) saw the largest declines in share of unemployment insurance compensation between 2019 and 2020. These shifts in distributions were triggered by changes in relative economic fortunes.
To estimate the impact of COVID-19 on traditional UI spending, we calculated the difference between actual funding received by residents of the states and the projected funding levels. State-level projected funding was calculated using OMB’s February 2020 spending projections and the 2019 state allocation shares. We are assuming that if COVID-19 had not happened, the distribution of unemployment shares between the states would not have changed as dramatically as they had.
On average, the Federal government distributed $298 more per person than they had expected. The three states receiving the most in additional UI compensation were California ($19.1 billion), New York ($11.0 billion), and Texas ($7.7 billion). On a per capita basis, the states that received the most in additional UI were Hawaii ($834), Nevada ($654), Massachusetts ($569), New York ($545), and California ($485). These five are among the states with the highest average unemployment rates. With a greater portion of the workforce seeking unemployment compensation, the states received higher per capita payments. All five of these states were in the top 10 per capita recipients of pandemic unemployment as well.
In 2020, the Federal government expended $72.0 billion, or $215 more per person, on the Medicare program than originally projected. The COVID-19 public health emergency disproportionately impacted the elderly, among other groups, leading to increased spending on Medicare, the healthcare program for the elderly.
In response to the pandemic, the Centers for Medicare & Medicaid Services (CMS) expanded its existing Medicare Accelerated and Advance Payment Programs.[20] The purpose of the expansion was to compensate healthcare providers for revenue losses sustained due to the cessation of non-COVID-related procedures. In addition, Congress waived the 2 percent reduction in Medicare payments required under budget rules. Congress also increased Medicare payments by 20 percent for inpatient COVID-19 treatments. This additional spending further increased the correlation between Medicare disbursements and state population.
Funds were distributed based on population and age meaning that larger states with older populations saw the biggest increase in total expenditures. There are limited variation in per capita funds per state. Florida received $279, 29.8 percent more per resident than the US average. Utah, a state with a low median age, received the lowest per capita distribution at $123 per person.
The Supplemental Nutrition Assistance Program (SNAP) also saw increased expenditures in FFY 2020. The additional $19 billion in spending was the equivalent of $57 per resident. Higher population states saw the largest increases in total funding. New Mexico, Hawaii, and Louisiana saw the largest increases in per capita funding.
COVID Spending’s Impact on Balance of Payments
The distribution of COVID-19 relief funding improved every states’ balance of payments with the Federal government. For the first time since at least 2015, the first year for which the Rockefeller Institute conducted this analysis, all 50 states had a positive balance of payments.
The spending also shifted the relative positions of the the states in the balance of payments. Much of the funding was distributed on a per capita basis. As a result, more populus states like California, Texas, Florida, and New York received the largest shares of the COVID-19 relief funding. Some of these programs, such as the Provider Relief Fund and pandemic unemployment relief, distributed more to the states hardest hit by the pandemic and economic impacts. As a result, New York increased from 50th in total balance of payments in FFY 2019 to fifth. California moved from 47th to first.
The chart below shows how states ranked in total balance of payments in FFY 2019, FFY 2020, and in FFY 2020 if COVID-19 spending were excluded from the balance of payments calculation. There are a number of inverted Vs in the chart. These are states, such as Connecticut, New Jersey, Washingon, and New York, that received a large amount of COVID-19 funding, explaining the sharp increase between 2019 and 2020. However, when the COVID-19 funds are excluded from the balance of payments calculations, these states are restored to ranks more in line with the pre-COVID Federal budgets.
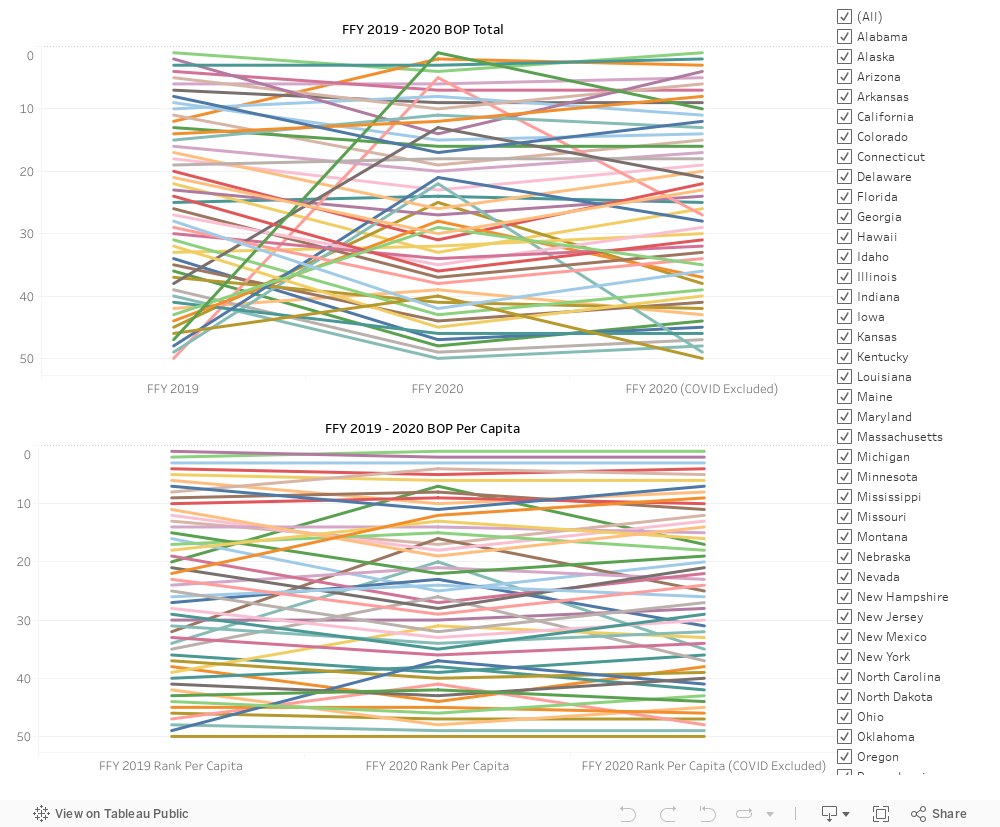
States with V shapes, such as Kentucky, Alabama, and Wyoming, received relatively smaller portions of the COVID relief funding, but retained their ranks in the categories that traditionally make up Federal spending. On average, states shifted 10 spots in their ranking between FFY 2019 and FFY 2020. The shift between FFY 2019 and FFY 2020 COVID-19 excluded funding was six spots.
When adjusted for population, changes in rank are not as drastic. There were minimal shifts between the states in the top and bottom five. States that saw the greatest improvements were Rhode Island (32nd to 16th), Wyoming (34th to 20th), Massachusetts (49th to 37th), and Arizona (22nd to 12th). No other state saw a double digit shift when adjusted and the average shift was five spots. For most states when COVID-19 spending is excluded, most states return to their FFY 2019 rank. The average shift was only two positions.
Implications for 2021 and Beyond
The changes in the relative position of the states in this year’s balance of payments is likely to continue for the next few years. The Federal response to the COVID-19 pandemic necessitated unprecedented levels of expenditures. The four COVID-19 spending packages passed in FFY 2020 authorized $2.59 trillion in budgetary resources. These were followed by the COVID Relief & Omnibus Spending bill (PL 116-68)[21] enacted in December 2020 and the American Rescue Plan Act (PL 117-2)[22] enacted in March 2021. In total, there has been $4.6 trillion in budgetary resources dedicated to addressing the pandemic and the recovery.[23] These funds will be allocated over several fiscal years to come. In FFY 2021, the US Department of the Treasury reported $6.8 trillion (compared to $6.6 in FFY 2020) in spending and a deficit of $2.8 trillion ($3.1 trillion in FFY 2020). It is almost certain that FFY 2021 will be another year with no negative balances of payments and no net donor states. As recovery funds continue to flow for years to come, the balance of payments will continue to be more favorable than in the pre-COVID era.
However, this preliminary analysis suggests that when COVID-19 funding is excluded from the analysis, the fundamental fiscal relationships between the states and the Federal government have not changed. It is likely that once the last of the COVID-19 funds are spent, we will return to the norms that are driven by demographic trends. The states with higher incomes, like New York, Massachusetts, Connecticut, New Jersey, and California, will regain their status as donor states to the Federal government.
ACKNOWLEDGMENT
A special thank you to Rockefeller Institute Fellow Lynn Holland for her contributions to this research.
ABOUT THE AUTHOR
Laura Schultz is executive director of research at the Rockefeller Institute of Government
NOTES
[1] Laura Schultz and Lynne Holland, Giving or Getting? New York’s Balance of Payments with the Federal Government: 2022 Report (Albany, NY: Rockefeller Institute of Government, March 2022), https://rockinst.org/issue-area/balance-of-payments-2022/.
[2] The Federal Fiscal Year starts in October. FFY 2020 was October 1, 2019 through September 30, 2020.
[3] “How is the federal government funding relief efforts for COVID-19?,” Data Lab, USAspending.gov, accessed March 24, 2022, https://datalab.usaspending.gov/federal-covid-funding/.
[4] “Paycheck Protection Program,” US Small Business Administration, accessed March 23, 2022, https://www.sba.gov/funding-programs/loans/covid-19-relief-options/paycheck-protection-program.
[5] “Economic Impact Payments,” US Department of the Treasury, accessed March 24, 2022, https://home.treasury.gov/policy-issues/coronavirus/assistance-for-american-families-and-workers/economic-impact-payments.
[6] “Coronavirus Relief Fund,” US Department of the Treasury, accessed March 24, 2022, https://home.treasury.gov/policy-issues/coronavirus/assistance-for-state-local-and-tribal-governments/coronavirus-relief-fund.
[7] “PPP Data,” US Small Business Administration, accessed March 23, 2022, https://www.sba.gov/funding-programs/loans/covid-19-relief-options/paycheck-protection-program/ppp-data.
[8] “PPP loan forgiveness,” US Small Business Administration, accessed March 24, 2022, https://www.sba.gov/funding-programs/loans/covid-19-relief-options/paycheck-protection-program/ppp-loan-forgiveness.
[9] “COVID-19 Economic Injury Disaster Loan,” US Small Business Administration, accessed March 24, 2022, https://www.sba.gov/funding-programs/loans/covid-19-relief-options/eidl.
[10] “About Targeted EIDL Advance and Supplemental Targeted Advance,” US Small Business Administration, accessed March 24, 2022, https://www.sba.gov/funding-programs/loans/covid-19-relief-options/covid-19-economic-injury-disaster-loan/about-targeted-eidl-advance-supplemental-targeted-advance.
[11] Andrew Van Dam, “North Dakota businesses dominated the PPP. Their secret weapon? A century-old bank founded by radical progressives,” Washington Post, May 15, 2020, https://www.washingtonpost.com/business/2020/05/15/north-dakota-small-business-ppp-coronavirus/.
[12] “Pandemic Unemployment Assistance (PUA) Implementation and Operating Instructions,” US Department of Labor, accessed March 24, 2022, https://wdr.doleta.gov/directives/attach/UIPL/UIPL_16-20_Attachment_1.pdf.
[13] “Unemployment Insurance Program Letter No. 15-20,” US Department of Labor, accessed March 23, 2022, https://wdr.doleta.gov/directives/corr_doc.cfm?DOCN=9297.
[14] “Economic Impact Payments.”
[15] “Coronavirus Relief Fund.”
[16] H.R. 748 – CARES Act,” Congress.gov, March 27, 2020, https://www.congress.gov/bill/116th-congress/house-bill/748/text.
[17] “Public Law 116-139–Apr. 24, 2020: Paycheck Protection Program and Health Care Enhancement Act,” US Congress, April 24, 2020, https://www.congress.gov/116/plaws/publ139/PLAW-116publ139.pdf.
[18] “Budget of the U.S. Government, Fiscal Year 2021,” US Government Publishing Office, February 10, 2020, https://www.govinfo.gov/features/budget-fy2021.
[19] “Budget of the U.S. Government, Fiscal Year 2022,” US Government Publishing Office, May 28, 2021, https://www.govinfo.gov/features/budget-fy2022.
[20] Nancy Ochieng, et al., “Funding for Health Care Providers During the Pandemic: An Update,” Kaiser Family Foundation, January 27, 2022, https://www.kff.org/coronavirus-covid-19/issue-brief/funding-for-health-care-providers-during-the-pandemic-an-update/.
[21] “H.R. 133 – Consolidated Appropriations Act, 2021,” Congress.gov, December 27, 2020, https://www.congress.gov/bill/116th-congress/house-bill/133/text/enr.
[22] “H.R. 1319 – American Rescue Plan Act of 2021,” Congress.gov, March 11, 2021, https://www.congress.gov/bill/117th-congress/house-bill/1319/text.
[23] “The Federal Response to COVID-19,” USASpending.gov, accessed March 24, 2022, https://www.usaspending.gov/disaster/covid-19?publicLaw=all.