
September 2017
Policymakers should have the best information available to understand the impact of a law before changes are entertained. As a national conversation on federal tax policy is underway, taxpayers deserve to know how much their state generates for the U.S. Treasury, and how much comes back in the form of federal spending.
It is no surprise that a higher-income state such as New York would contribute more than its share of federal tax revenue, but many indicators such as health care costs and poverty rates show that we also have programmatic needs. The comparison between what a state’s taxpayers send to the federal government and Washington’s return investment in that state is known as a balance of payments.
The New York State Division of the Budget provided financial support for the research and publication of this report so that we may fully understand how New York’s balance of payments compares to other states.
The report illuminates the outsized role New York has in supporting federal spending programs, nationally, and the relatively small amount that returns through social programs, contracts, and wages.
In 2015, New York’s taxpayers contributed $48 billion more to the federal government than what was returned to the state. This negative balance of payments was by far the highest in the nation and, in contrast, 37 other states receive more than they contribute.
We hope that the information herein informs the national discussion on federal tax policy. Thank you to the Rockefeller Institute of
Government, which has been providing evidence-based policy analysis since 1981. Through products such as this, citizens and governments are more informed and better prepared to make public decisions.
Sincerely,
Robert F. Mujica, Jr.
Budget Director
The federal government spent $3.7 trillion in federal fiscal year 2015, affecting the lives of all Americans. This spending and the revenue raised to support it are distributed differently across the country. Because one goal of the federal system is redistribution, it is not surprising that some states “give” far more than they “get,” while the opposite is true for other states.
Before policymakers can draw conclusions about whether there is too much redistribution or too little, they need to understand what the facts are, and why. To help with this goal, the Rockefeller Institute of Government examined each state’s “balance of payments” with the federal government — the amount of revenue paid to the federal government from the state’s residents and economy, compared to federal spending in the state. We examined the data in detail for federal fiscal year 2015, paying particularly close attention to New York.
The main conclusions are clear: In 2015, New York’s residents and economy contributed approximately $48 billion more in taxes to the federal government than New York received in federal spending. New York’s negative balance of payments was the largest of any state by far, roughly equaling the combined shortfalls of #2-ranked New Jersey and #3-ranked Illinois. California and Massachusetts rounded out the list of top five states.
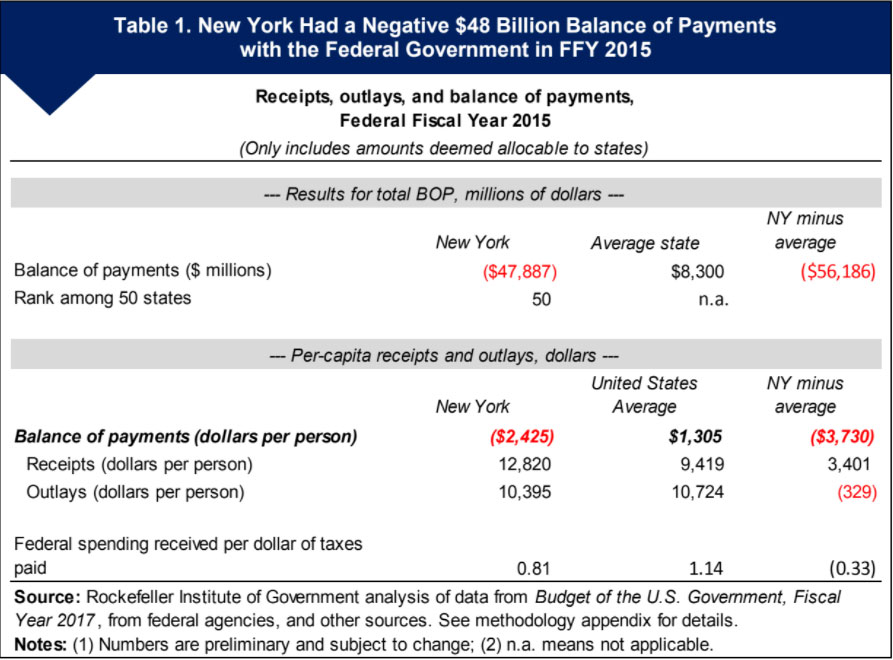
New York had the third-worst balance of payments in the country per capita, after New Jersey and Connecticut. Its negative balance of payments was about $2,425 per person. That is, New York’s people and economy paid the federal government $2,425 more per person than they received. By contrast, the average state experienced a positive balance of payments of about $1,305 per capita.
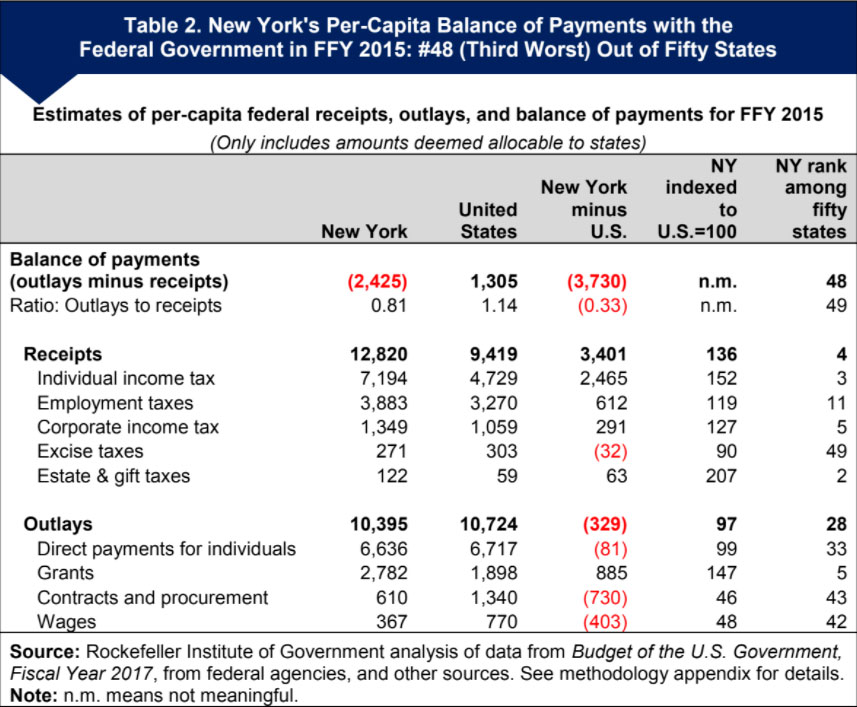
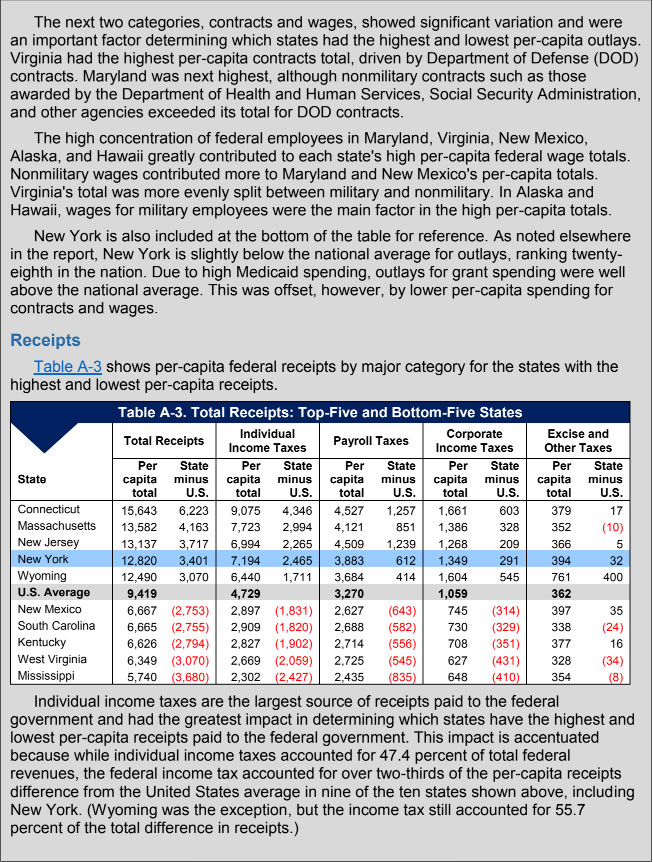
The federal individual income tax accounted for $2,465, or more than 70 percent, of the $3,401 difference between New York’s federal taxes per capita and the U.S. average (Table 2). While New York has above-average poverty, it ranks fourth among the fifty states in per-capita income. Furthermore, it has many high-income taxpayers who are in the highest federal tax brackets under the progressive federal income tax. As a result, although New York’s per-capita income is about 22 percent above the national average, its federal income tax per capita was more than 50 percent higher than the national average. New York’s federal employment taxes and corporate income taxes also are much higher than the national average, reflecting New York’s higher average wages and higher income from capital.
By contrast, federal spending in New York, per capita, was $329 lower than the national average. This reflects lower federal spending on federal workers and contracts in New York, offset somewhat by the state’s higher federal grants, especially for Medicaid and other social programs. Direct payments for New Yorkers, which include programs such as Social Security and Medicare, about equaled the national average.
The net result is that per-capita payments to the federal budget from New York’s residents and economy were fourth highest in the nation, but spending was only 28th highest, making New York’s overall per-capita balance of payments third worst (forty-eighth out of fifty states).
It is instructive to examine this relative to the size of the state’s economy, as measured by its gross domestic product (GDP). New York contributes 17.5 percent of its GDP to the federal government, which is greater than the United States average of 16.8 percent. However, it ranks second from the bottom in federal spending in the state relative to GDP. New York’s balance-of-payments position has worsened considerably since the last analysis of this issue, conducted by the Office of the New York State Comptroller (OSC) in 2015 for federal fiscal year 2013.1
In that analysis, New York’s balance of payments was a negative $20 billion, and its per-capita ranking was fifth worst among the fifty states. The balance of payments fell in New York and, generally, in other states primarily because federal tax receipts (the amounts states “give”) increased much faster between 2013 and 2015 than did federal outlays (the amounts states “get”).2 For the nation as a whole, federal tax receipts increased by 17 percent ($475 billion) but outlays increased by only 7 percent ($234 billion). Because New York pays a disproportionately large share of federal taxes, its balance of payments declined more than the balances in other states.
Federal policymakers have begun to debate possible tax rate reductions and tax reforms. They may also consider sizable cuts in federal spending and reformulation of grant programs to offset some revenue lost to tax cuts. Depending on the nature of these changes, some states will be affected very differently than others. Understanding how the federal budget currently is distributed is a crucial first step in understanding whether proposed federal changes are fair and appropriate.
The federal government spent $3.7 trillion in federal fiscal year 2015,3 affecting the lives of all Americans. This spending and the revenue raised to support it are distributed differently across the country.
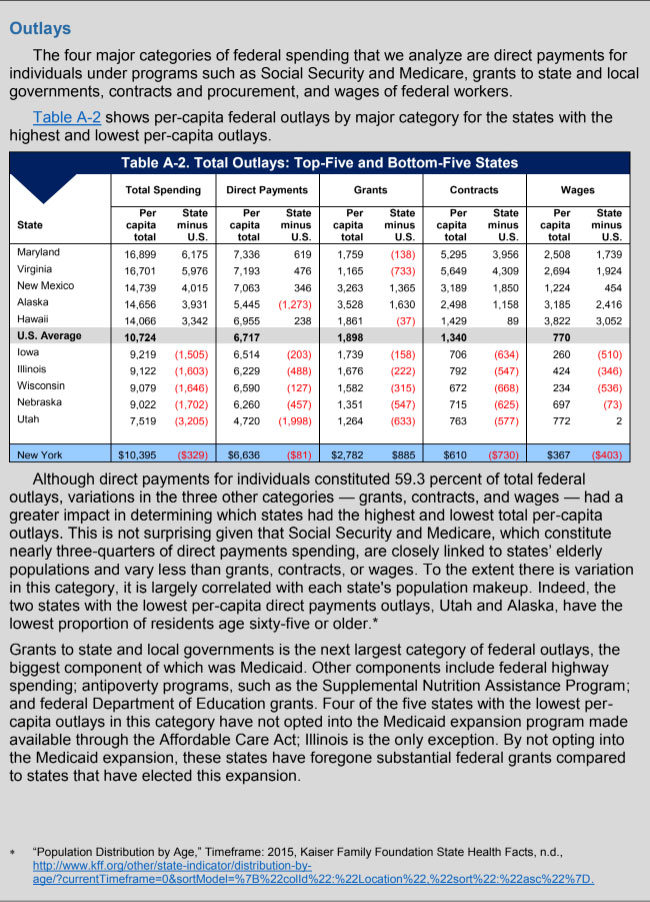
Grants to support aid for the needy are concentrated disproportionately among higher poverty states and states with high spending on programs partially matched by the federal government, such as Medicaid. Direct payments for individuals under Social Security and Medicare are disproportionately concentrated in states with large elderly populations. Federal contracts are dominated by states with large defense-contracting sectors, and federal wages are disproportionately concentrated in states with a large federal employment presence, particularly those near the District of Columbia. Federal revenue, on the other hand, is raised disproportionately from residents of states with many high-income individuals, who pay at the highest rates under the progressive federal income tax.
The net result is that some states “receive” far more federal spending than their residents or economies pay through taxes, while others “give” far more than they get. This is not necessarily bad: the federal system redistributes income through Medicare, Medicaid, and other programs that help those in need or with limited means, and through the progressive income tax structure. Furthermore, we would not expect spending to be uniformly distributed — for example, spending on contracts and federal wages should depend at least in part on where goods and services may be most efficiently provided.
Although there may be understandable reasons why some states receive more than they give, and vice versa, it is important to understand how and why federal spending and revenue are distributed. Only then can policymakers decide whether the current distribution is fair and appropriate. Developing a baseline understanding is particularly important now, given that federal tax reform and federal budget cuts could cause significant changes in how federal spending and revenue are distributed.
The Rockefeller Institute of Government has analyzed the distribution of federal budget receipts and outlays (i.e., spending) across the states, sometimes referred to as a “Balance of Payments” (BOP) analysis. This report provides our analysis for the 2015 federal fiscal, with an emphasis on how New York is affected.
To conduct this analysis, the Institute allocated the federal budget to states in two steps:
This approach ensures that the sum of amounts allocated to individual states and other geographic areas, plus a small amount of unallocable receipts or outlays, equals the federal budget totals. Thus, all numbers allocated to states are consistent with the federal budget. We believe this analysis provides a reasonable basis for our findings and conclusions based on our report objectives. For a detailed discussion of our methodology see the “Objectives, Scope, and Methodology” Appendix.
In 2015, New York’s residents and economy contributed approximately $48 billion more in taxes to the federal government than New York received in federal spending. New York’s negative balance of payments was the largest of any state by far, roughly equaling the combined total of #2-ranked New Jersey and #3-ranked Illinois. California and Massachusetts rounded out the list of top five states.
New York had the third-worst balance of payments in the country per capita, after New Jersey and Connecticut. Its negative balance of payments was about $2,425 per person. That is, New York’s people and economy paid the federal government $2,425 more per person than they received. By contrast, the average state experienced a positive balance of payments of about $1,305 per capita.
New York’s negative balance of payments is driven primarily by federal taxes, rather than spending: Payments from New York residents and the New York economy to the federal government were $12,820 per capita, or approximately $3,401 higher than the national average. While federal spending in New York was $329 lower than the U.S. average, adding to the revenue disparity, the revenue difference is much larger than the spending difference (see Table 3).
The federal individual income tax accounted for $2,465, or more than 70 percent, of the $3,401 difference between New York’s federal taxes per capita and the U.S. average. While New York has above-average poverty, it ranks fourth among the fifty states in per-capita income. Furthermore, it has many high-income taxpayers who are in the highest federal tax brackets under the progressive federal income tax. As a result, although New York’s per-capita income is about 22 percent above the national average, its federal income tax per capita was more than 50 percent higher than the national average. New York’s federal employment taxes and corporate income taxes are also much higher than the national average, reflecting New York’s higher average wages and higher income from capital.

By contrast, federal spending in New York, per capita, was $329 lower than the national average (see Table 3). Federal grants per capita are nearly 50 percent higher than the national average in New York, driven by Medicaid and other social programs. However, federal procurement and wages in New York, per capita, are only about 50 percent of the national average, and direct payments for programs such as Social Security and Medicare are only about equal to the national average. New York’s higher grants are more than offset by lower federal spending on contracts and wages, leaving New York with below-average federal spending per capita.
The net result is that per-capita payments to the federal budget from New York’s residents and economy were fourth highest in the nation, but spending was only twentyeighth highest, making New York’s overall per-capita balance of payments third worst (forty-eighth out of fifty states). And as discussed above, New York’s balance of payments in absolute dollars was worst in the nation.
This is remarkably similar to the conclusion from Senator Moynihan’s last published analysis, despite more than fifteen intervening years: New York pays more than it receives because (1) high incomes among segments of the New York population combined with a progressive federal tax system lead to greater revenue per capita from New York than from the typical state; and (2) despite higher than average federal spending in New York on assistance programs such as Medicaid, low federal spending on contracts and discretionary items means that federal spending in New York is below average.
Thirty-seven states had a positive balance of payments with the federal government, receiving more spending than their taxpayers and economy paid for federal taxes and other federal receipts. (Because the federal government spent more than it raised, federal spending in the average state was greater than federal receipts.) New York was one of only thirteen states that had a negative balance of payments (see Figure 1; see Table 4 in the appendix for state-by-state details).
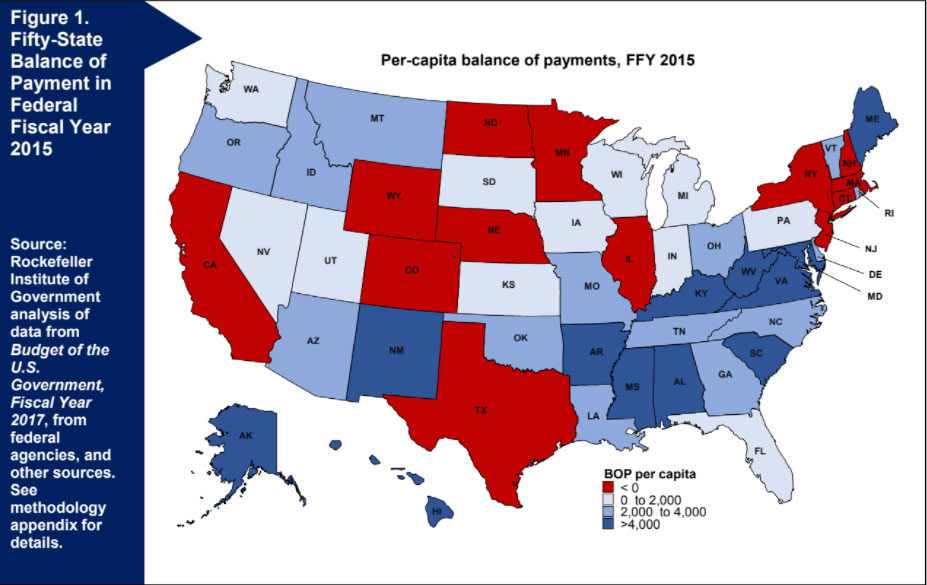
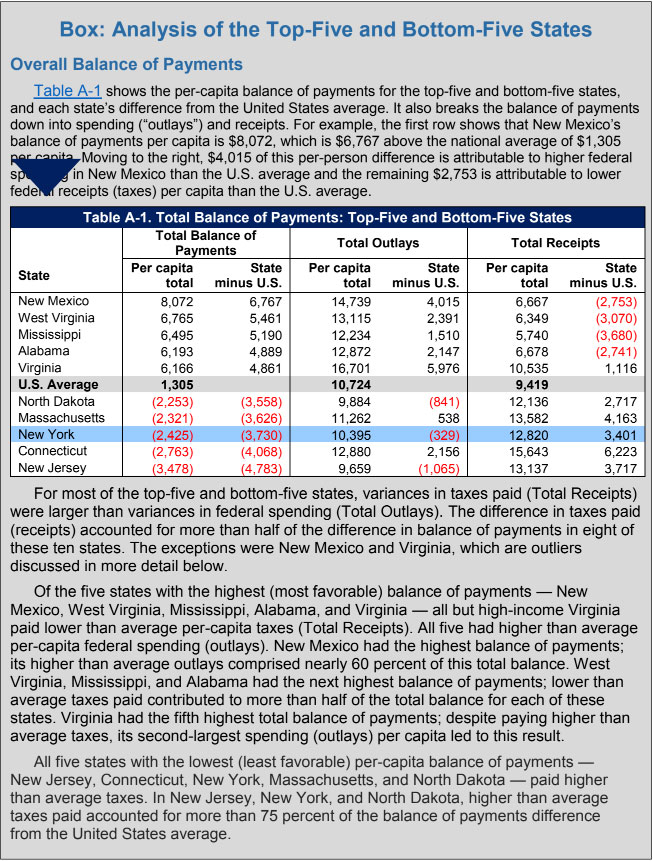
Different states have high or low balances of payments for different reasons. Some states, such as New York, pay higher taxes than other states and receive lower spending. Some states, such as New Mexico, pay lower taxes than other states and receive higher spending. In other states, there are offsetting reasons. For example, Virginia pays higher taxes but receives much higher spending than the average state, giving it a positive balance of payments. (See “Box: Analysis of the Top-Five and Bottom-Five States” for analysis of the top five and bottom five states.)
Figure 2 shows payment of federal taxes and receipts per person, by state. The darker blue states have the highest federal tax payments and the lighter blue states have the lowest payments (New York is in the darkest-blue group). States paying the highest federal taxes per capita tend to have high per-capita incomes and highly industrialized economies.
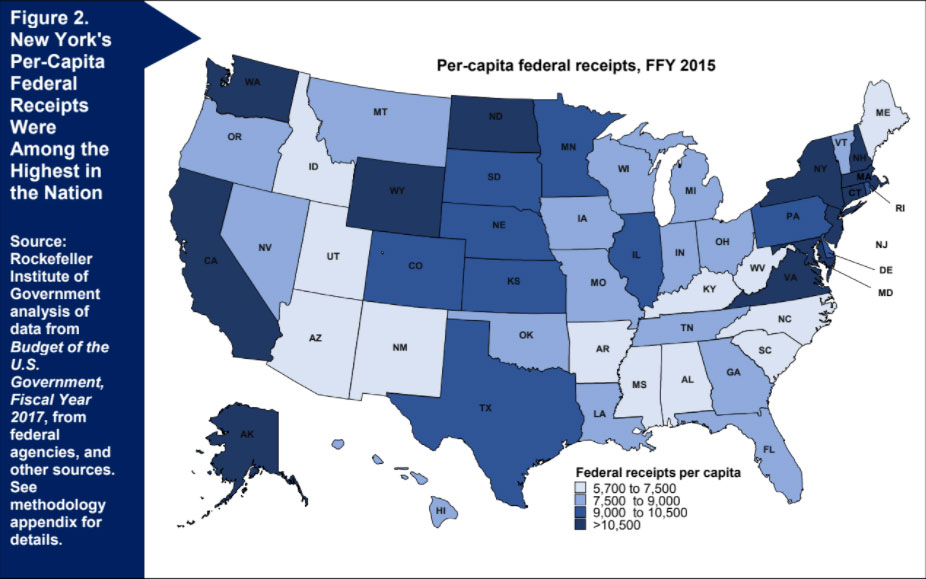
Figure 3 shows federal outlays (spending) per capita, by state. The darker blue states have the highest federal spending per capita. Many of the darkest blue states are near the District of Columbia and have disproportionate amounts of federal wages and procurement spending; other dark blue states have relatively high poverty and receive considerable federal spending under Medicaid and other social welfare programs. New York is a lighter blue, slightly below the U.S. average.
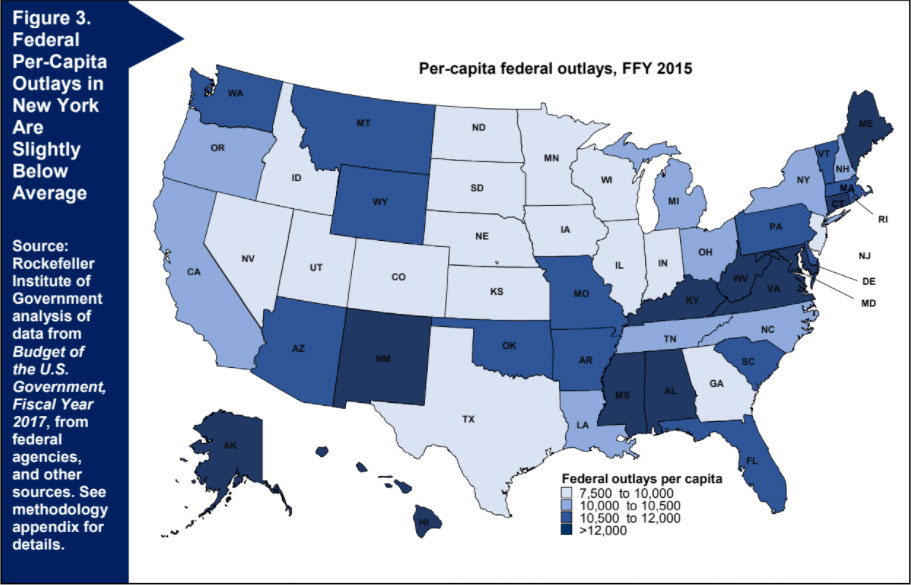
Figure 4 shows each state’s position relative to other states for per-capita outlays and receipts. The dashed lines show national averages. The figure shows that federal receipts per capita are far higher in New York than in the average states, while federal spending per capita in New York is moderately lower. Other states are high or low for different reasons. Maryland and Virginia both have dramatically higher federal spending per capita than the average state. Analysis of the detailed results shows that in both cases the higher outlays are driven by federal procurement and wages, which are much higher than in the average state.
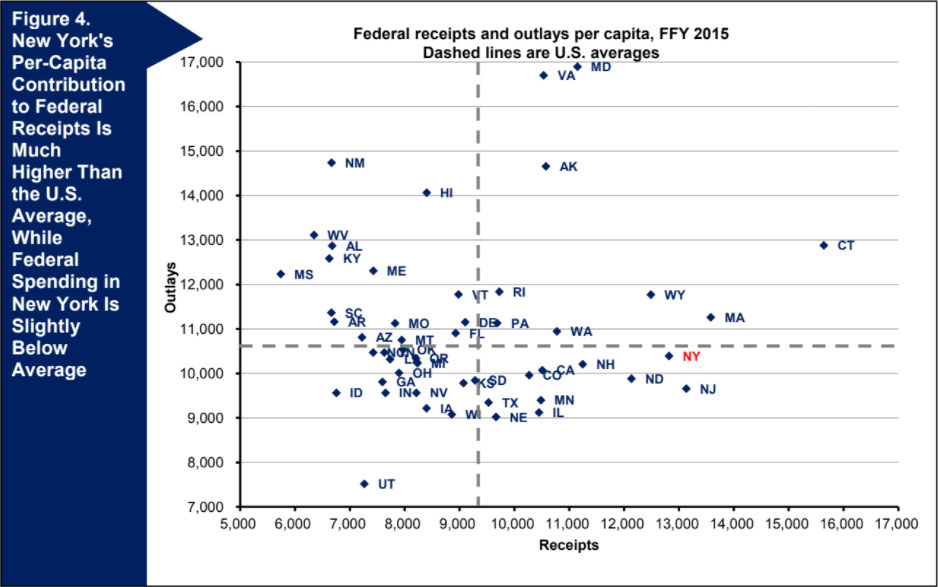
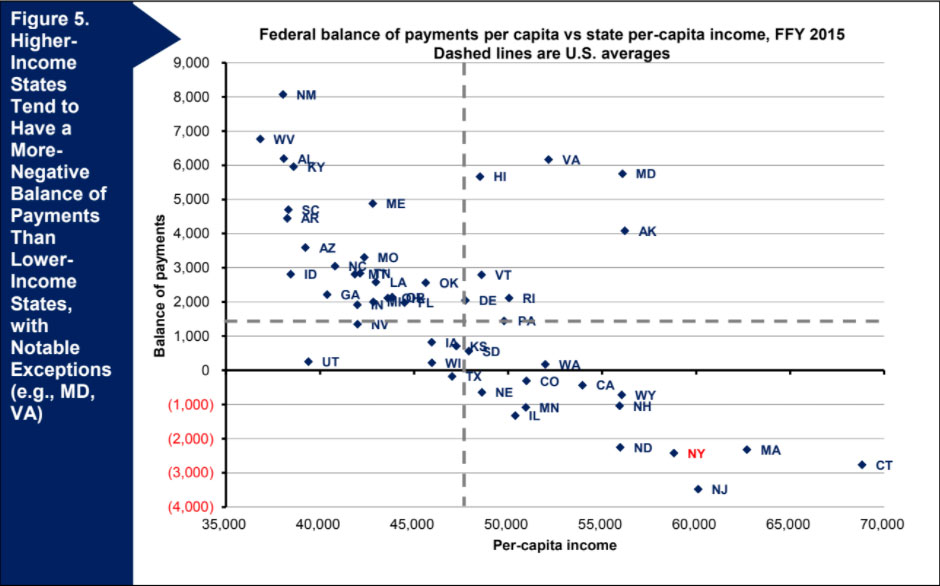
Figure 5 shows the per-capita balance of payments relative to state per-capita income. Lower-income states generally do better than average and higher-income states generally fare worse than average, but with some very notable differences, such as Maryland and Virginia for the reasons just mentioned.
It is instructive to view federal receipts and outlays relative to the size of the state’s economy, as measured by its gross domestic product (GDP). New York contributes 17.5 percent of its GDP to the federal government, which is greater than the United States average of 17.0 percent. Thus, even relative to the size of its large and diverse economy, New York pays in more than average. However, it ranks second from the bottom in federal spending as a percentage of GDP — it receives far less spending than the average state, relative to its economy. The net result is that New York’s balance of payments as a percentage of GDP ranks third from the bottom among the fifty states (see Table 7) for state-by-state numbers).
In 2015, New York’s residents and economy contributed approximately $48 billion more in taxes to the federal government than New York received in federal spending. By contrast, thirty-seven states had a positive balance of payments with the federal government, receiving more spending than their taxpayers and economy paid for federal taxes and other federal receipts. New York had the greatest negative balance of payments, in dollars, of all states in the nation. New York had the third-worst balance of payments in the country per capita, after New Jersey and Connecticut.
New York’s negative balance of payments is driven primarily by federal taxes from the state’s residents and economy that are higher than the U.S. average: These payments to the federal government were $12,820 per capita, or $3,401 higher than the national average. Federal spending in New York was $10,395, $329 lower than the U.S. average, adding to the disparity, but the revenue difference is much larger than the spending difference. The net result is that payments to the federal budget from New York’s residents and economy were fourth highest in the nation, but spending was only twenty-eighth highest, making New York’s overall per-capita balance of payments third worst (forty-eighth out of fifty states).
It is instructive to examine federal receipts and outlays relative to the size of the state’s economy, as measured by its gross domestic product (GDP). New York contributes 17.5 percent of its GDP to the federal government, which is greater than the United States average of 16.8 percent. However, it ranks second from the bottom in federal spending as a percentage of GDP. New York’s balance of payments as a percentage of GDP ranks third from the bottom.
New York’s balance-of-payments position has worsened considerably since the last analysis of this issue, conducted by the Office of the New York State Comptroller in 2015 for federal fiscal year 2013, primarily because federal revenue increased by 17 percent and New Yorkers paid a disproportionate share of the increase.
Federal policymakers have begun to debate possible tax rate reductions and tax reforms. They may also consider sizable cuts in federal spending and reformulation of grant programs to offset some revenue lost to tax cuts. Depending on the nature of these changes, some states will be affected very differently than others. Understanding how the federal budget currently is distributed across the nation is a crucial first step in understanding whether proposed federal changes are fair and appropriate.