March 23, 2023
In its sixth annual analysis, the Rockefeller Institute of Government estimates Federal revenues derived from and the distribution of budgetary expenditures to each state. This report examines not only the amount of Federal funds that every state generates and receives, but also the respective net difference between the two, referred to by the late Senator Daniel Patrick Moynihan as a state’s balance of payments. This report strives to shed light on both the source of these differences and how they have changed over time.
As policymakers consider whether there is too much or too little redistribution of funding, this analysis illuminates the impact of these decisions on constituents in each state. This report presents detailed estimates of revenue and spending data for Federal fiscal year (FFY) 2020 and preliminary estimates for FFY 2021. While the analysis herein is national in scope, it places the focus squarely on New York.
As speculated in last year’s report, the results of this year’s analysis for FFY 2021 are very similar to those for FFY 2020, with New York’s ranking relative to other states slipping only one place from fifth to sixth most favorable net total dollar balance of payments. The analysis confirms for a second year that the innovative design of the Federal emergency spending programs to address the economic impact of COVID-19, comprised in large part of direct payment to individuals, represents a more equitable distribution of aid than those that have been used in the past.
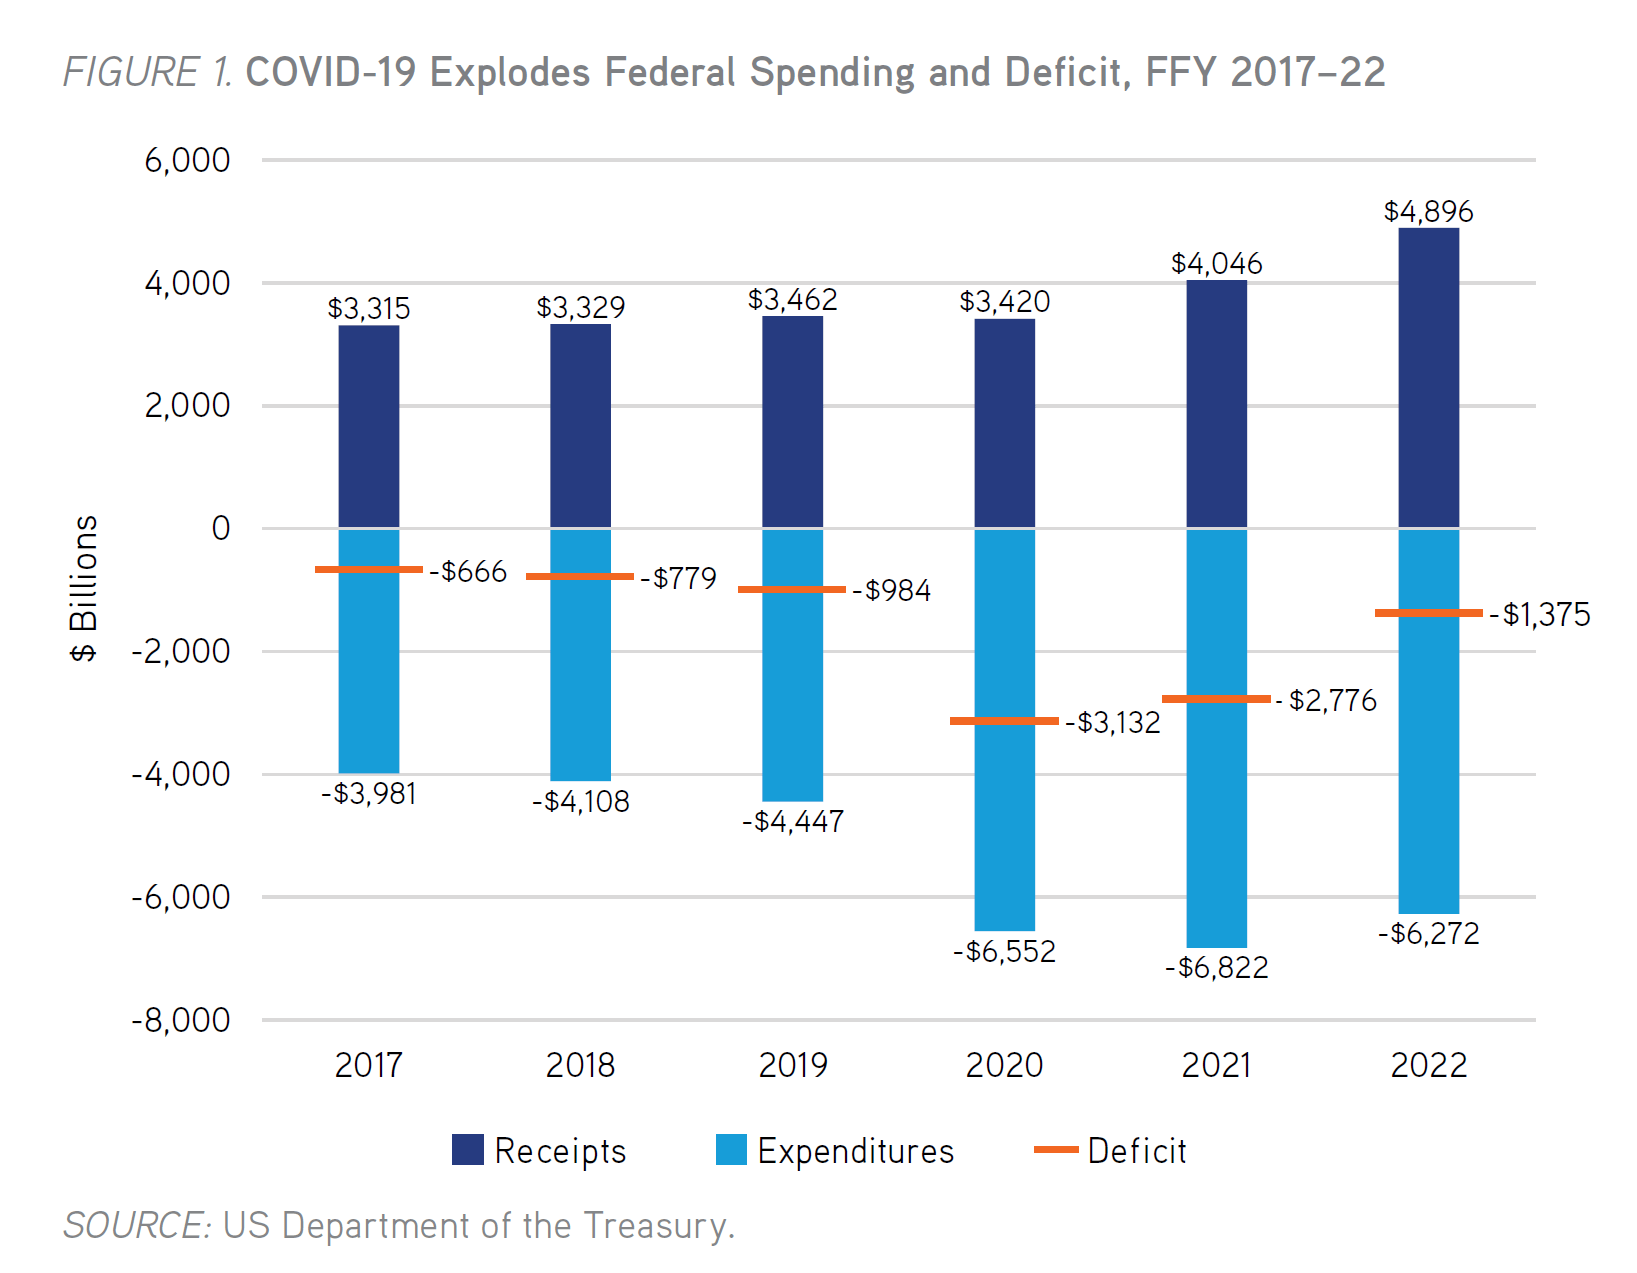
As portrayed in Figure 1, receipts collected by the Federal government grew by an even greater rate than expenditures in FFY 2021, but the level of receipts continued to be overwhelmed by that of expenditures. Thus, at $2.775 trillion, the Federal deficit for FFY 2021 was $357 billion less than the prior year, but was nevertheless the second-highest Federal deficit in history. It is therefore no surprise that there are once again no net donor states for FFY 2021.
To address the impact of the COVID-19 pandemic on the national economy, the Federal government authorized spending programs totaling $2.6 trillion in FFY 2020 and almost $3.0 trillion in FFY 2021. Expenditures under these programs are estimated to have totaled $1.5 trillion and $1.8 trillion for FFY 2020 and FFY 2021, respectively. These Federal programs were designed to disburse the largest sums of relief funding to the individuals with the greatest volume of need, resulting in a significant share of the funding going to the most populous states in both years.
New York accounted for a disproportionately high share of the growth in Federal receipts in FFY 2021, based on preliminary data, but a disproportionately lower share of the growth in expenditures. As a consequence, the state’s rank based on its net balance of payments position among the 50 states is estimated to have slipped one place from fifth most favorable for FFY 2020 to sixth for 2021. But New York’s performance for both years represents a monumental improvement from its rank of 50th for every year the Rockefeller Institute conducted this analysis prior to FFY 2020. Indeed, FFY 2020 and FFY 2021 represent the only years for which the state has not ranked among the bottom five on a per capita basis in the history of this analysis.
The data presented in Figure 1 depict an 8.1 percent decline in Federal expenditures for FFY 2022; at the same time, receipts grew 21.0 percent, even stronger than in the prior year, as the nation continued to recover from the worst of the pandemic. As a result, the Federal budget deficit for FFY 2022 shrank by an impressive 50.4 percent to $1.4 trillion. These data signal FFY 2022 as a transitional year for the Federal budget. As US fiscal policy returns to business as usual, it is likely that New York’s net balance of payments position will deteriorate substantially unless policymakers can devise more equitable methods for distributing Federal aid to the states. Key findings from this year’s report include:
The extraordinary impact of Federal emergency spending programs on New York’s 2020 balance of payments position led to an examination of Federal expenditures both with and without these programs. We repeat this examination for FFY 2021. Four major pieces of legislation were passed by Congress and signed into law during FFY 2020, which in total authorized pandemic relief spending of up to $2.73 trillion: the Coronavirus Preparedness and Response Supplemental Appropriations Act ($8 billion), the Families First Coronavirus Response Act ($22 billion), Coronavirus Aid, Relief, and Economic Security Act (CARES) ($1,760 billion), and the Paycheck Protection Program and Health Care Enhancement Act ($483 billion). In December 2020, Congress passed the Coronavirus Response and Relief Supplemental Appropriations Act (CRRSA), which authorized the spending of approximately $991 billion to address the ongoing impact of the pandemic, while the enactment of the American Rescue Plan (ARP) Act in March 2021 authorized the spending of another approximately $1,962 billion.
As a result of the disproportionate impact of the pandemic on the state economy, New York obtained a greater share of total Federal spending in 2020 and 2021 than in the past. Specifically, New York received 6.3 percent of total Federal expenditures in both 2020 and 2021, compared with 5.8 percent for 2019. Of the funding authorized by the six major COVID-19 emergency spending bills, New York is estimated to have received 7.8 percent of the associated expenditures in 2020 and 8.2 percent in 2021. For example, New York’s share of funding from all Federal unemployment insurance programs jumped from 7.4 percent in 2019 to 10.2 percent in 2020 and 13.8 percent in 2021. As a point of comparison, New York was home to 6.1 percent of the US population in 2020. In contrast, New York is estimated to have received only 5.8 percent of non-COVID-19-related Federal expenditures in 2020 and 5.6 percent in 2021. The latter shares are more comparable to the state’s 2019 share of Federal expenditures of 5.8 percent.
This year’s analysis also revised the preliminary analysis for FFY 2020 by using the Internal Revenue Service’s 2020 Statistics of Income series. Based on updated data for the 2020 tax year, New York’s share of total Federal personal income tax liability was revised downward from 8.7 percent to 8.3 percent. As a result, New York is estimated to have paid $4.6 billion less in income tax than originally projected. Moreover, updated Federal expenditures data reduced New York’s estimated Federal funding allocation by $23.5 billion. These were the primary factors behind the downward revision to the 2020 balance of payments estimate from $159.7 billion to $145.9 billion.
As the overall distribution of tax burdens and Federal budgetary spending across the nation changes over time, understanding how these changes impact states provides critically important information when evaluating the fairness and appropriateness of proposed changes to fiscal policy.