March 11, 2022
In its fifth annual analysis, the Rockefeller Institute of Government estimates the distribution of Federal budget receipts and expenditures across the United States. This report examines where Federal funds are generated and spent, the balance of payments differentials that exist across states, the primary explanations for those differences, and how those gaps have changed over time.
This annual analysis is designed to aid policymakers as they continue to debate whether there is too much redistribution or too little, and the impact of their decisions on the states. This report presents detailed estimates of revenue and spending data for Federal fiscal year (FFY) 2019 and preliminary estimates for FFY 2020. While the report presents a national analysis, the focus is placed squarely on New York.
This year’s analysis makes clear that FFY 2020 was a fiscal year like no other due to the COVID-19 pandemic. Billions of dollars were distributed to state governments, local communities, and healthcare providers to address the public health emergency. The Federal government responded to the pandemic-induced shock to the economy in a starkly different manner than it had responded to previous economic crises. Perhaps learning some of the lessons from the weak and protracted recovery from the Great Recession, Congress passed in rapid succession several trillion-dollar programs, comprised in large part of direct payments to individuals. As a result, a Federal budget deficit of $3.1 trillion was incurred, by far the largest in history.
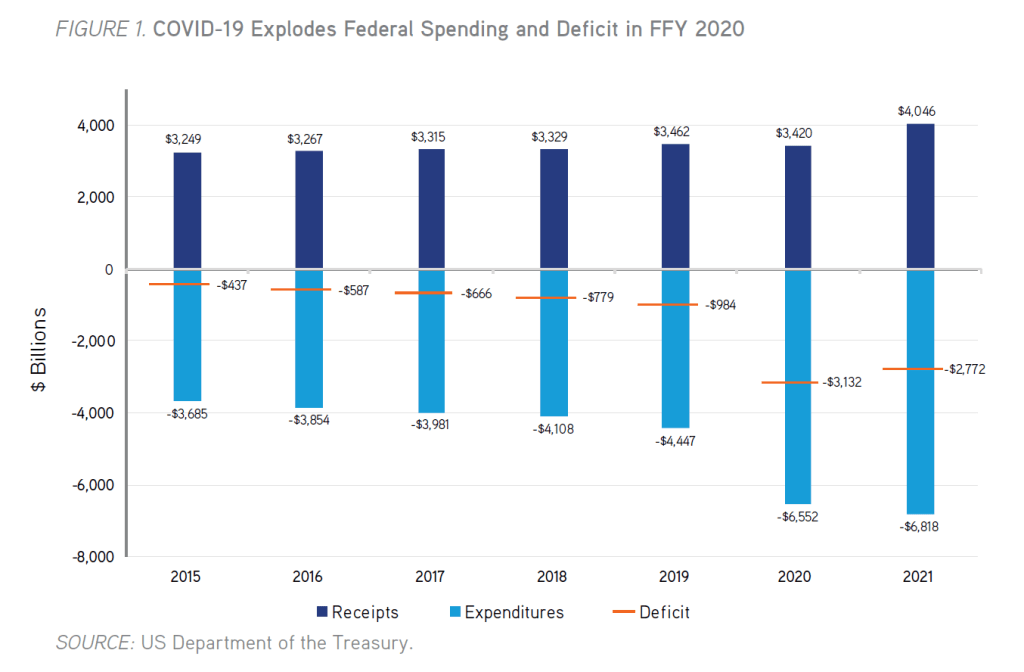
By design, these Federal programs disbursed the largest sums of relief funding to the states with the largest volume of need, which translated to the most money going to the most populous states. As a result—and perhaps for the first time in recent memory—there are no net donor states. The implications for New York were transformative: New York’s rank based on its net balance of payments position among the 50 states improved from 50th, for all the years the Rockefeller Institute has conducted this analysis, to fifth for FFY 2020. The figure above indicates a Federal budget deficit for FFY 2021 of $2.8 trillion, only slightly lower the prior year, portending the likelihood that there will be no net donor states for FFY 2021 as well. Key findings from this year’s report include:
The extraordinary impact of Federal emergency spending programs on New York’s 2020 balance of payments position led to an examination of Federal expenditures both with and without these programs. Four major pieces of legislation were passed by Congress and signed into law during FFY 2020, which in total authorized pandemic relief spending of up to $2.59 trillion: the Coronavirus Preparedness & Response Supplemental Appropriations Act ($8 billion), the Families First Coronavirus Response Act ($19 billion), Coronavirus Aid, Relief, and Economic Security Act (CARES) ($2,080 billion), and the Paycheck Protection Program and Health Care Enhancement Act ($483 billion). It is estimated that these four programs resulted in expenditures totaling upwards of $1.5 trillion before the end of FFY 2020.
As a result of the disproportionate impact of the pandemic on the state economy, New York received 6.33 percent of Federal expenditures in 2020, compared with 5.85 percent for 2019. For example, New York’s share of funding from all Federal unemployment insurance programs jumped from 7.2 percent in 2019 to 10.2 percent in 2020.
Of the funding authorized by the four major COVID-19 emergency spending bills, New York is estimated to have received 7.74 percent. New York is estimated to have received 5.85 percent of Federal non-COVID-19 related expenditures, approximately equal to the state’s 2019 share of Federal expenditures.
This year’s analysis also revised the preliminary analysis for FFY 2019 by using the 2019 Statistics of Income series published by the Internal Revenue Service (IRS). When updated with 2019 liability data, New York’s personal income tax share fell from 9.1 percent to 8.6 percent for 2019. As a result, New York paid $8.2 billion less in income tax than originally projected. Additional updated data increased New York’s estimated Federal funding allocation by $9.4 billion. These were the primary factors in the upward revision of the 2019 balance of payments estimate from -$22.7 billion to $21.7 billion.
As the overall distribution of tax burdens and Federal budget spending across the nation changes over time, understanding how these changes impact the states provides critically important information when evaluating the fairness and appropriateness of proposed changes in fiscal policy.