
A recent report by the Rockefeller Institute evaluated how all fifty states compared in terms of the tax revenue they sent to the federal government (receipts) and the levels of spending they received from the federal government (expenditures). When looking at the map below, one of the most immediately evident trends is the bright red cluster in the Northeast. New York, New Jersey, Massachusetts, and Connecticut have a combined negative balance of payments (BOP) of $87.3 billion. In this posting we are going to take a closer look at factors that lead to the Northeast subsidizing federal spending in the rest of the states.
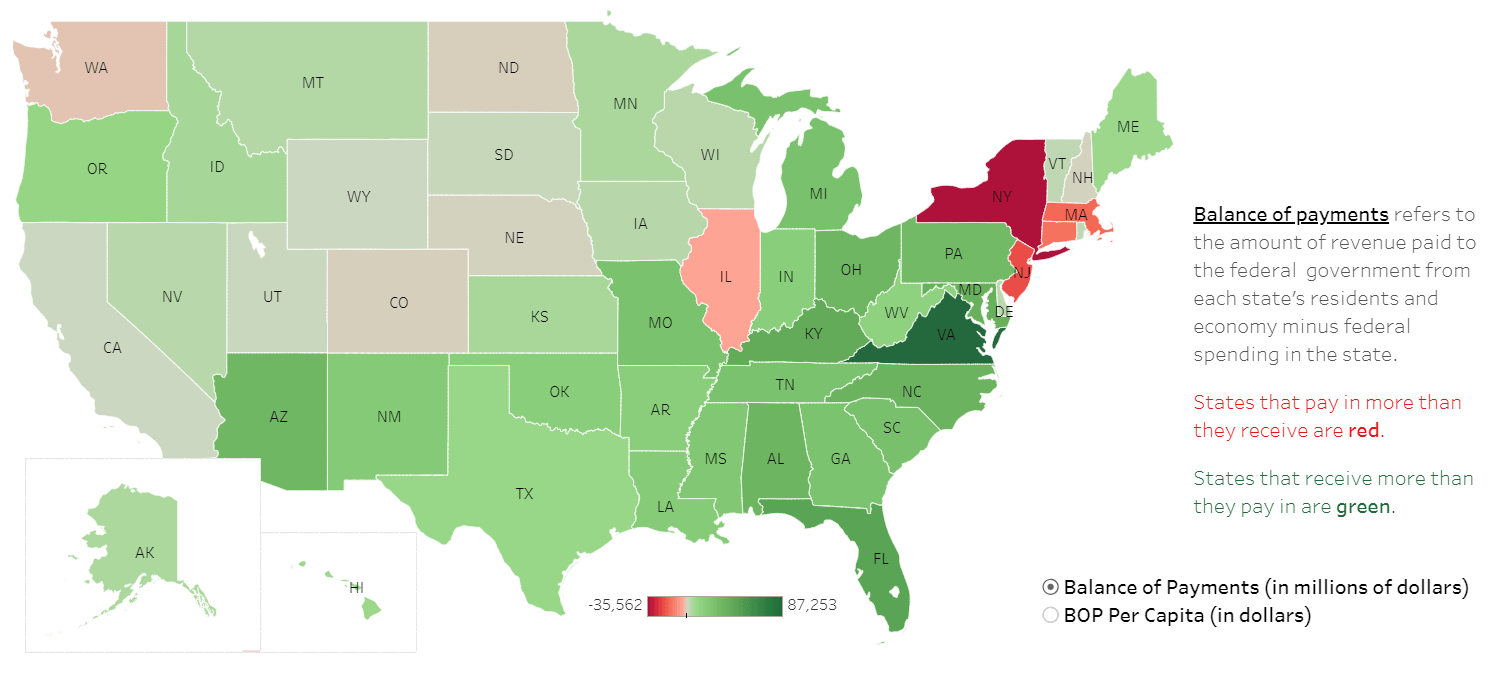
The table below shows balance of payments, adjusted for state population, for the four largest “givers” and the national average. For every dollar these four states pay in federal tax revenues, they receive only 83 cents back in federal spending. This is 37 cents below the national average. This list remains relatively unchanged with the same four states making up the bottom as did in 2015. Two years ago, the rankings were New Jersey (50), Connecticut (49), New York (48), and Massachusetts (47).
Balance of Payments ($ per capita)
| Receipts | Expenditures | BOP $ | Federal Spending per $1 | Rank | |
| Connecticut | 15,462 | 11,462 | -4,000 | 0.74 | 50 |
| New Jersey | 13,215 | 10,847 | -2,368 | 0.82 | 49 |
| Massachusetts | 13,820 | 11,477 | -2,343 | 0.83 | 48 |
| New York | 12,906 | 11,115 | -1,791 | 0.86 | 47 |
| United States | 9,532 | 11,457 | 1,925 | 1.20 |
Balance of payments is calculated by subtracting total receipts paid to the federal government from the expenditures made in a given state. A look at the two categories above shows that the states in the Northeast receive close to the national average in federal spending. The high balance of payments is driven by the much higher-than-average receipts, or tax revenues, generated in the Northeast.
In FFY 2017, the US states collected approximately $3.1 trillion in revenue. Receipts are made up of the following revenue sources: income and employment taxes (personal income tax and social insurance tax), corporate income taxes, excise taxes, and other receipts or fees.
Composition of Federal Revenue, 2017
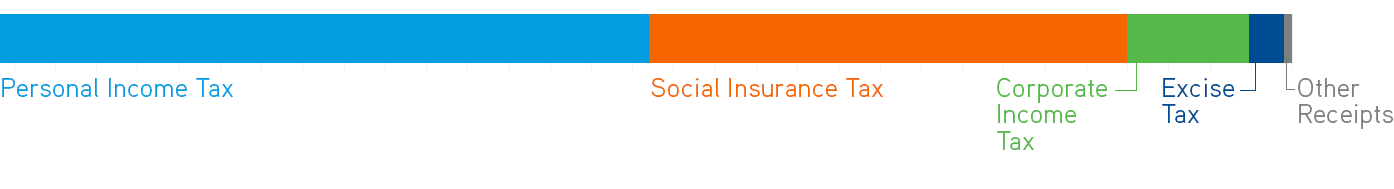
Taxes that are directly related to an individual’s wages are the principal source of revenue for the federal government. In 2017, 87 percent of all tax revenue were payroll taxes calculated based on an individual’s income, making it the single most important factor in determining a state’s tax burden. A state that has more wealth, or higher per capita personal income, will have a higher tax base and burden than other states. Per capita income is the measure of wages and supplements to income. An examination of personal income on a per capita basis shows that the states which rank the highest are likely to also be a net giver for purposes of the balance of payment computation. The table below shows the personal income for the five highest earning states. With one exception, the rankings for personal income per capita are the same as the calculation for BOP receipts. Maryland, the exception, is able to offset their income tax contribution by being a “winner” in the expenditure category.
Personal Income (per capita) and Balance of Payments
| 2017 Personal Income per Capita | Rank Personal Income | Rank BOP | |
| Connecticut | $ 70,121 | 1 | 50 |
| Massachusetts | $65,890 | 2 | 49 |
| New Jersey | $62,554 | 3 | 48 |
| New York | $60,891 | 4 | 47 |
| Maryland | $59,524 | 5 | 8 |
| US Average | $50,392 |
Source: “State Personal Income: Preliminary estimates for 2017,” U.S. Bureau of Economic Analysis, March 22, 2018, https://apps.bea.gov/regional/histdata/releases/0318spi/index.cfm.
The four states in the Northeast generated almost 17 percent of all federal receipts but were home to only 11.8 percent of the US population. The result is that the personal income tax and Social Security taxes collected from the higher earning workers in the Northeast subsidize spending elsewhere in the US, primarily in the southeast. See an upcoming blog on why a state such as Maryland and the Southeastern states are the big balance of payments recipients.
Michelle Cummings is a policy analyst at the Rockefeller Institute of Government