
An Update on State Heroin and Other Opioid Reporting Data
The opioid crisis, which was recently declared a public health emergency, continues to claim lives throughout New York and across the United States more broadly. In order to properly understand the problem and begin working towards a solution, we need timely and accurate reporting.
In a recent blog, we discussed the difficulties — such as underreporting and other inconsistencies — that can arise when data are collected locally from individual communities. In New York State, discrepancies can arise from the different types and quality of local reporting systems. For example, thirty-eight counties rely on publicly elected coroners to investigate, determine, and assign the cause of death on death certificates, whereas twenty-one counties use the medical examiner system. Unlike medical examiners, coroners are not required to be physicians or even to undergo extensive forensic pathology training. As elected public health officials, they “have discretion in determining the cause of death and whether to perform an autopsy,” and yet such data are used when reporting the total number of heroin-related deaths, as well as the causes and consequences of overdoses.
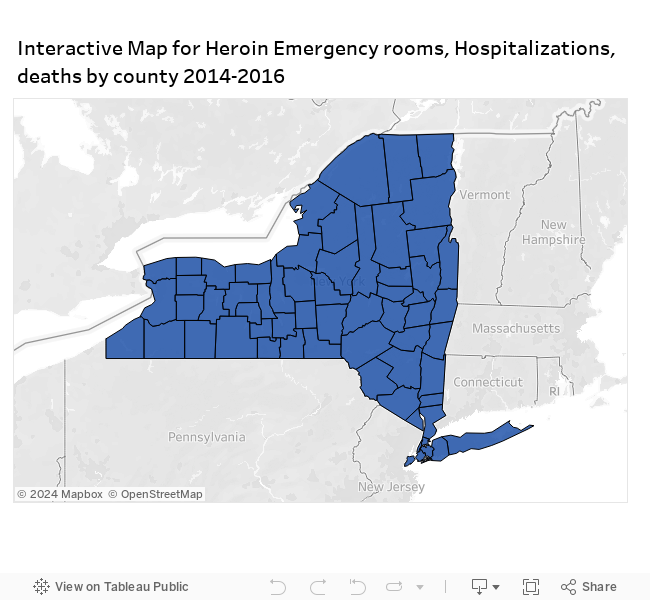
In an attempt to assist various stakeholders and report the latest data available for New York State, the Rockefeller Institute recently introduced an interactive map showing the total number of heroin overdoses as they relate to deaths, emergency room visits, and hospitalizations in individual counties. Since the data are taken from the quarterly reports released by the New York State Department of Health, we are updating the interactive map below to include the latest available information. (Source: County Opioid Quarterly Report for New York State Counties.)
Some of the most prominent increases in the number of heroin-related deaths are highlighted in the table below:
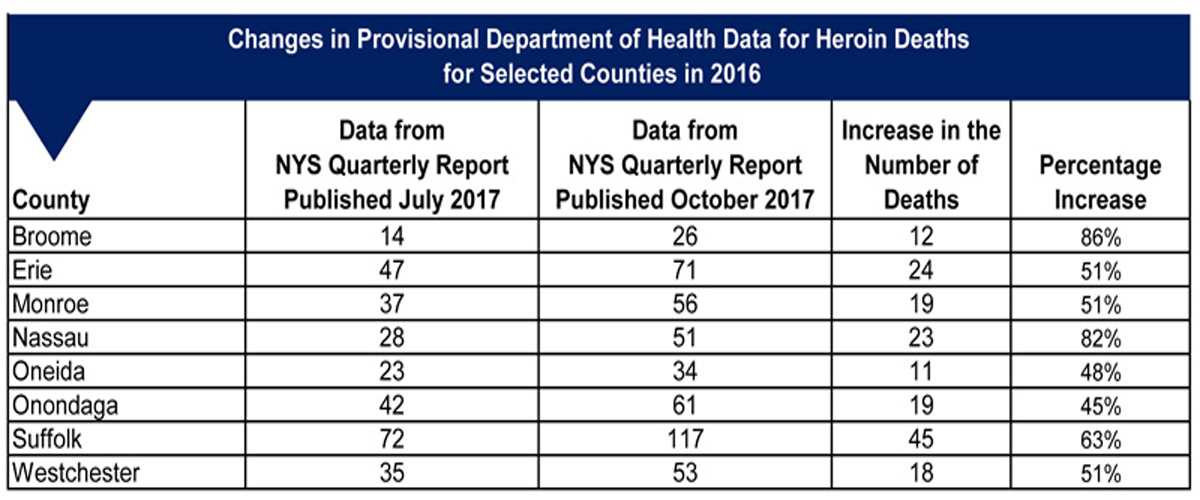
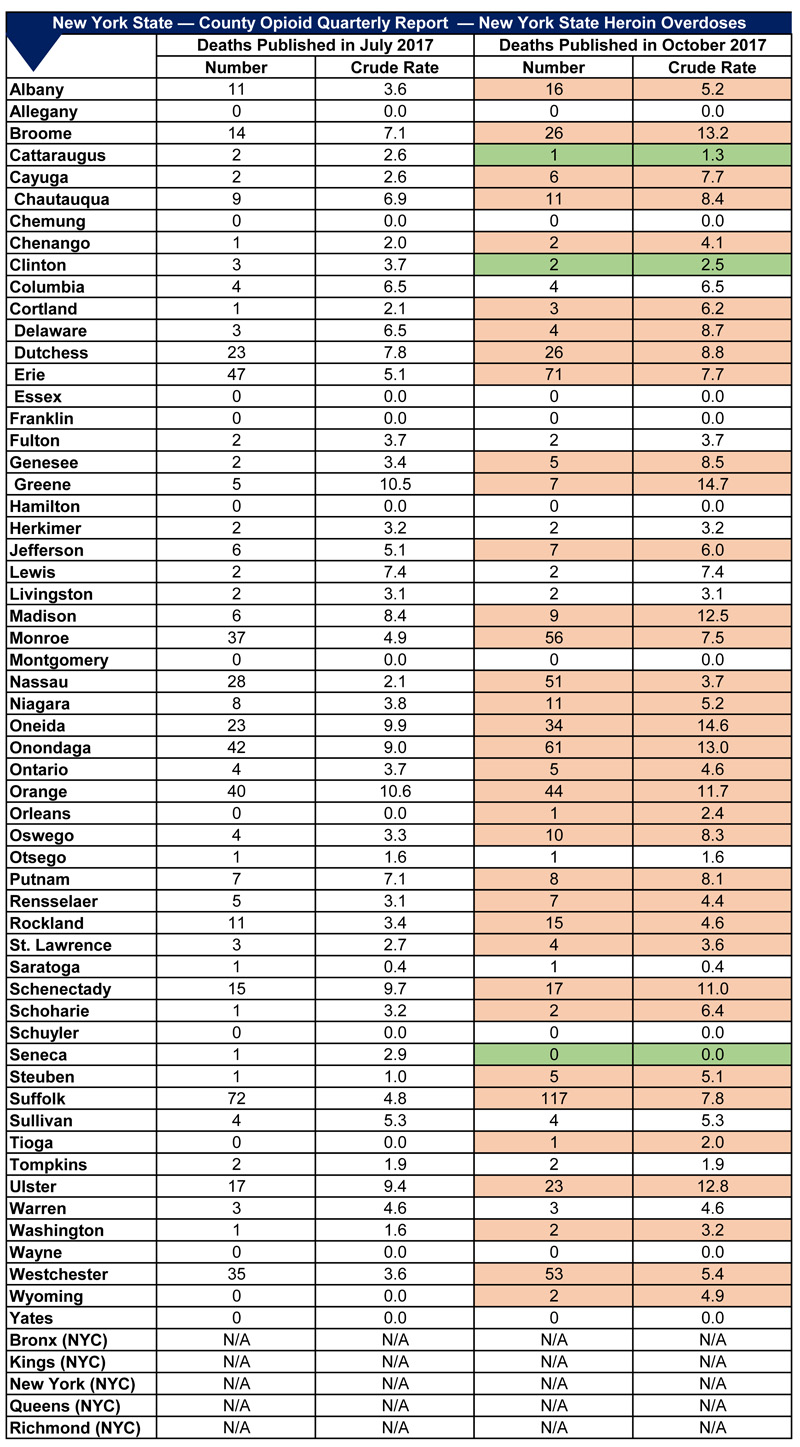
Eight counties — Broome, Erie, Monroe, Nassau, Oneida, Onondaga, Suffolk, and Westchester — had their previously overall heroin – related death totals adjusted upward. For example, as indicated by the table, the greatest increase in the number of deaths in the revised data was reported in Broome County with an 86 percent increase from the previously reported data. Nassau County’s adjusted number of deaths increased 82 percent. Three counties — Cattaraugus, Clinton, and Seneca — saw a minor decrease of one death from previously reported data.
For a complete list of changes in the most recent county opioid quarterly report, please see the table below. We will continue to provide up-to-date information as it becomes available. As we’ve said before, we can only address this crisis with good data.
SOURCES
2014 https://www.health.ny.gov/statistics/opioid/data/pdf/2014_opioid_report.pdf
2015 https://www.health.ny.gov/statistics/opioid/data/pdf/nys_jul17.pdf
2016 https://www.health.ny.gov/statistics/opioid/data/pdf/nys_oct17.pdf