
To date, the Federal government has allocated almost $2.5 trillion to individuals, businesses, state and local governments, schools, and healthcare providers to relieve the fiscal and economic costs of the COVID-19 pandemic. The Coronavirus Aid, Relief, and Economic Security (CARES) Act was passed by Congress and signed by President Trump on March 27, 2020. Major provisions of the law included:
- Economic Impact Payments to individuals of up to $1,200.
- The Coronavirus Relief Fund provided payments to state and local governments to compensate them for the costs of addressing the public health crisis.
- The Paycheck Protection Program created forgivable loans for small businesses to help them maintain payroll, rehire furloughed employees, and cover overhead expense.
- The Provider Relief Fund distributed funding to health care providers to address the increased costs associated with the treatment of COVID-19 patients and offset the revenues lost to cancellation of elective procedures.
The law also expanded unemployment coverage and assistance, extended payment deadlines for tax returns and student loans, funded loans for larger corporations, increased funding for safety net programs, and distributed funding to colleges that could be used to support students.
Data are now being released detailing the distribution of several of the CARES Act provisions. The Rockefeller Institute has created a data dashboard to track how Federal COVID-19 relief spending is being dispersed across the states. The dashboard includes data from three of the federal programs.
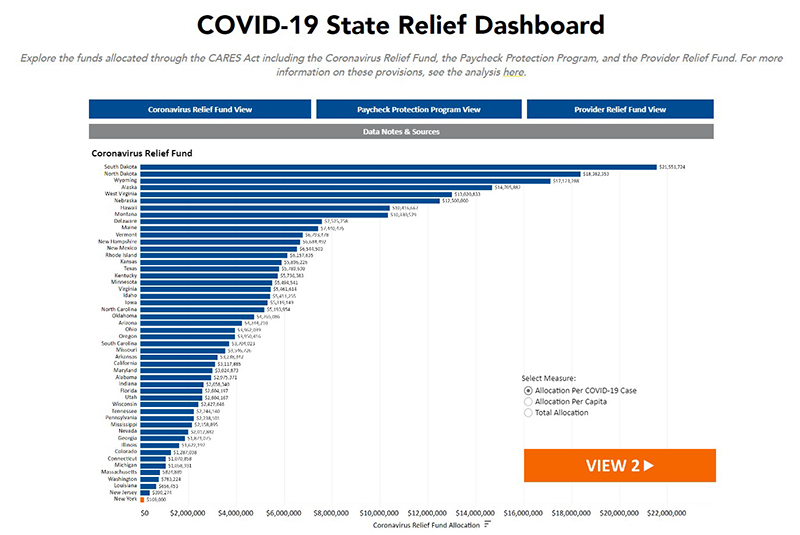
Coronavirus Relief Fund
The Coronavirus Relief Fund distributed $150 billion to states, local governments with populations greater than 500,000, US Territories, and tribal governments. The funding can be used to finance expenditures relating to the public health emergency incurring between March 1 and December 30, 2020. It could not be used to offset lost revenues or other expenses. Each state received a minimum of $1.25 billion and amount was scaled up based on population. The funding a state received was not dependent on the severity of the pandemic.
The dashboard presents data relating to the total allocation to a state. The state’s allocation includes funding to the state government and all local governments within the state. These estimates were taken from the Congressional Research Service’s report. The dashboard also shows allocation per capita and allocation per COVID-19 case. The per COVID-19 case calculation is based on the number of cases in a state on March 27, 2020 the date the act was signed into law.
Paycheck Protection Program
The Paycheck Protection Program authorized $349 billion for a loan program implemented by the Small Business Administration (SBA). Small businesses could apply for loans to cover eight weeks of payroll costs. Businesses could also use the funds to pay interest on mortgages, rent, and utilities. If the businesses retained their workers on payroll, the loans would be forgiven. The program was extremely popular and funds ran out on April 16, 2020. The program was extended with an additional $310 billion through the Paycheck Protection Program Increase Act (PPPIA) of 2020 on April 24, 2020.
The data on the dashboard is taken from the SBA’s report on round one of the program. It includes information on the number of loans awarded for each state and the total allocation received by small businesses in the state. The dashboard also calculates the ratio of number of loans received/number of small business employers in the state. The number of small business employers has been taken from the SBA’s Small Business Profiles for the State and Territories. A number closer to one suggests that the businesses in the state were effective in accessing the funding in the program. A number closer to zero suggests a small portion of eligible businesses were successful in securing funding and there may still be significant need for funding in the state. As round two funding becomes available, it will be included in the dashboard.
Provider Relief Fund
The CARES act and the subsequent PPPIA, provided $175 billion in relief funds for hospitals and health care providers. In order to quickly distribute these funds, $50 billion ($30 billion in CARES and $20 billion in PPPIA) in funds were distributed to health care providers based on their Medicare reimbursements in 2018. In order to receive the funds, health care providers were required to attest to payments and agree to Terms and Conditions. As of May 4, over $20 billion have been distributed. The original distribution was criticized for not taking into consideration the severity of the public health crisis. Subsequent allocations will be targeted to high impact areas, rural providers, those serving the uninsured, and providers who only take Medicaid clients.
The dashboard shows the total funding allocated to each state as of May 4. The dashboard also shows allocation per capita and allocation per COVID-19 case.
We will continue to update this dashboard as data updates become available. The data sources and notes will include information on data sources and dates of access.
ABOUT THE AUTHOR
Laura Schultz is director of fiscal analysis and senior economist at the Rockefeller Institute of Government
Nicholas Simons is project coordinator at the Rockefeller Institute of Government