
The federal Paycheck Protection Program (PPP) was designed amidst the COVID-19 pandemic response to help small businesses keep their workers on payrolls during a period of forced shutdown or diminished services. Small businesses are generally defined as those with fewer than 500 employees. In 2017, there were 31.7 million small businesses employing 47.1 percent of US workers. The first of its kind program was administered by the Small Business Administration (SBA). Businesses could apply for loans to cover eight weeks of payroll costs, later extended to 24 weeks as the program adapted to business needs. The businesses were also allowed to use the funds to pay other necessary expenses to stay open including interest on mortgages, rent, and utilities. If the businesses retained their workers on payroll, the loans would be eligible for forgiveness.
The program was initially authorized with $349 billion of funding as part of the Coronavirus Aid, Relief, and Economic Security (CARES) Act on March 27, 2020. So many businesses applied for the program, however, that funds ran out on April 16, 2020, less than two weeks after the program began. The program was then extended with an additional $310 billion through the Paycheck Protection Program and Health Care Enhancement Act (PPPHCA) of 2020 and the SBA resumed accepting applications for Round 2 on April 27, 2020. The end of the PPP program was likewise extended from June 30, 2020 to August 8, 2020.
More recently, the SBA released detailed data on lending activity related to the PPP program. While economists have begun to explore the impact of the program in looking at this data, it will be years before we understand how effective the PPP has been in achieving its goal of keeping workers employed and businesses afloat. In the short term, we can use preliminary program data to evaluate how the program evolved and the sectors in which it may have had an impact on employment. In this piece, we explore the differences in funding between Round 1 (April 3-16, 2020) and Round 2 (April 27-June 30, 2020) to see how the program changed in real time. We also explore the PPP funding awarded to businesses in New York State. We compare the number of PPP loans and jobs retained by industry with the unemployment insurance claims filed between March and June in the state. The goal is to assess whether the PPP effectively targeted the businesses in most need. The preliminary analysis suggests that health care and professional services sectors successfully used the PPP program to retain workers. The PPP was not as successful in offsetting job losses in the service sectors such as retail trade, accommodations, and food services.
About the Data
Upon completion of Round 1, the SBA has released regular reports on the status of the PPP. These reports include information on the size of the loans awarded, the lenders who processed the applications, and the allocation of funds by state and industry. In early July, the SBA released data on all loans awarded to that point. For loans greater than $150,000, the business names and addresses were provided. The exact loan amount is unavailable, but loans were categorized into one of five ranges of funding ($150-350K, $350K-1M, $1-2M, $2-5M, $5-10M). For loans less than $150,000, the exact value of the loan was provided but business names and addresses were suppressed. The SBA did include location information about the recipient, including city, state, and zip code. Data for all loans included the applicants’ industry (NAICS code), structure (corporation, LLP, etc.), and demographic details of the owner (gender, race/ethnicity, and veteran status) when provided. Details of the loan, including the lender and date approved, were published along with the number of jobs the business pledged to retain.
This administrative dataset is generated directly from the raw data contained in loan applications and has not been fully verified. Media outlets have identified problems with the dataset and speculated that they could be attributed to misreporting or fraud. Rockefeller Institute analysis did find some suspect data entries that suggest cleaning and further administrative verification of the dataset is warranted. For example, in Utah businesses retained 35 percent more jobs in small businesses than the US Census had reported existed in the state in 2017. In New York, the recipients in the mining industry retained jobs equivalent to 124 percent of the industry’s small business employment. Some of these issues may be related to inaccurate self-reporting or clerical errors in business categorization. For example, a review of firms reporting themselves in the mining sector found a few that sell granite countertops. These would be more appropriately classified in the retail or wholesale trade sector, such misclassifications could account for some of the discrepancies.
It should also be noted that the job retention data for a given business is a preliminary number reported at the time of the application based on current employment. The number of jobs actually retained will not be available until borrowers file for loan forgiveness.
Round 1 v. Round 2
The Paycheck Protection Program is an innovative program of tremendous scale not previously tried in the US, however the rollout was rocky. Businesses faced challenges submitting applications as lenders grappled with insufficient guidance and technical glitches paired with high levels of demand. Smaller businesses struggled finding lenders who would process their applications as banks moved their larger, established clients to the front of the line. In total, in thirteen days, Round 1 granted almost 1.7 million loans distributing $342 billion with an average loan size of $206,022.
Applicants for Round 1 of funding criticized the lack of prioritization of and access to lenders for businesses owned by women and people of color. There was also scrutiny of a handful of larger companies who accessed small business support through applications for individual locations.
Round 2 authorized an additional 3.2 million loans totaling $179 billion in funding. The second authorization designated $60 billion of the $310 billion in funding for community banks and community development financial institutions meant to target smaller businesses in underserved lower-income and disadvantaged communities. The second authorization also included language that excluded publically traded companies and designated a window for such businesses to cancel any loans they had already received.
Overview of Lending: Round 1 and Round 2
| Number of Loans | Funding | Average Loan Size | |
| Round 1 (April 16, 2020) | 1,661,367 | $342,277,999,103 | $206,022 |
| Round 2 (Calculated) | 3,224,021 | $179,205,818,653 | $55,585 |
| Total (June 30, 2020) | 4,885,388 | $521,483,817,756 | $106,744 |
The SBA has not published data comparing activity in Round 1 and Round 2. The Round 1 numbers presented above are from the report published shortly after the first round of funding concluded on April 16, 2020. The data from April would include any loans that have been cancelled since the date the report was issued. While current Round 2 numbers have not been published, they can be calculated based on the Round 1 data published in April and the final report published in early July 2020.
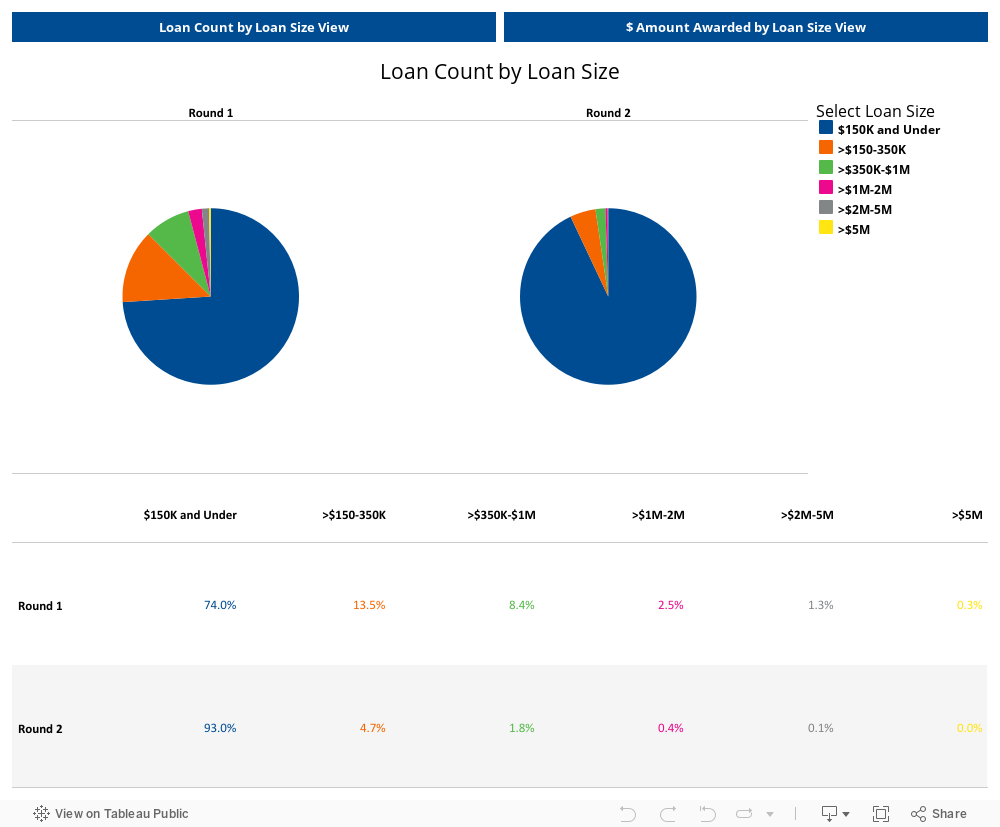
The loans awarded since the second authorization are significantly smaller than in Round 1. The average loan size in Round 1 was $206,022 compared to $55,585 in Round 2. In Round 1, almost three quarters of the loans granted were for less than $150K, but these small businesses received only 17 percent of the available funding. Distributions of $1 million or more, on the other hand, accounted for 4 percent of the granted loans, but 45 percent of the funding. In contrast, in Round 2, 93 percent of loans awarded were for $150,000 or less and these smaller loans accounted for almost 47 percent of total funding.
These differences are evidence that the larger businesses, with established relationships with funders, were the first to file their applications. Funding was awarded on a first-come first-served basis so the firms with internal finance departments, attorneys, and preexisting lending relationships with banks were better situated to collect the relevant supporting materials and prepare an application quickly. Such firms are more likely to be larger and require higher levels of funding. The smaller firms that needed more time to prepare their applications and find a lender to process them, were more likely to be waitlisted in the first round of funding.
The SBA has also regularly released the industry breakdown of funding. The earliest beneficiaries of the PPP program were construction, professional services, and manufacturing. Combined, the three industries received almost 38 percent of the Round 1 funding. The average loan amounts granted to construction and manufacturing firms were higher than the national average of $206,022. The manufacturing industries higher levels of loan payments was likely driven by their higher than average levels of employment. The average business with fewer than 500 employees in the US has 10.1 workers on payroll, but small manufacturers have an average of 20.6 workers (2017 US Census SUSB). As a result, manufacturing firms on average would be eligible for higher levels of funding.
Top 5 Industries by Funding, Rounds 1 & 2
| Round 1 | Round 2 | ||||
| Industry | Share of Funding | Average Loan Size | Industry | Share of Funding | Average Loan Size |
| Construction | 13.1% | $ 252,419 | Health Care and Social Assistance | 15.3% | $ 85,101 |
| Professional, Scientific, and Technical Services | 12.7% | $ 207,788 | Professional, Scientific, and Technical Services | 12.9% | $ 53,822 |
| Manufacturing | 12.0% | $ 375,906 | Construction | 11.0% | $ 68,195 |
| Health Care and Social Assistance | 11.7% | $ 217,348 | Other Services (except Public Administration) | 7.5% | $ 35,717 |
| Accommodation and Food Services | 8.9% | $ 188,418 | Manufacturing | 7.3% | $ 108,348 |
In Round 2, healthcare and social assistance firms, including medical offices and day cares, received the largest portion of funding. Firms in this sector accounted for 15 percent of small business employment in 2017 and employed an average of 13.8 workers. Also among the top five are firms in the other services sector, which would include personal care services, such as automotive repair, hair salons, spas, and religious organizations. Service firms are generally smaller, with an average of 6.8 employees, meaning they have relatively smaller payrolls and as a result they received smaller loans. The average loan size for every industry fell suggesting that the firms who received funding in the second round had fewer employees and smaller payrolls.
PPP and Unemployment in New York
The PPP program was designed to help small businesses keep their workers on payrolls and pay expenses. We can use preliminary loan data to evaluate whether or not PPP funds were allocated to the industries most harmed by the immediate economic fallout related to COVID-19. To identify the sectors most immediately affected, we look at the unemployment insurance (UI) claims by industry for the period of March 16-June 27, 2020. Firms that were not deemed essential and were not able to transition to remote work, were often forced to temporarily furlough or lay off employees. The sectors most dramatically impacted were accommodation and food services, retail trade, and healthcare and social assistances.
PPP applications required firms to identify the number of jobs they would retain with the funding. In order to be eligible for loan forgiveness, the firm needs to have the same number of people on payroll at the beginning of 2021 as they did at the time of their application. The number of jobs retained provides us with an idea of the magnitude of the PPP’s potential impact by sector. The discussion of Round 1 and Round 2 funding was an exploration of national trends. However, data on UI claims by industry is only published by some states and are not available nationally. In this analysis we focus on PPP awards and unemployment claims in New York State. In total, New York businesses received PPP funding to retain 3,162,720 workers on payroll. Over the period, 2,931,590 New Yorkers filed for unemployment.
The Paycheck Protection Program is an innovative program of tremendous scale not previously tried in the US…
The figure below compares the number of jobs retained by PPP recipients and the number of UI initial claims filed in New York over the period covered by the PPP. Employers could use PPP funding to either prevent layoffs or to quickly rehire workers who had already been laid off. This means that a subset of the workers retained by an industry could have filed a claim for UI when they were first laid off. There could be significant double counting in jobs retained and UI initial claims. The chart also presents the difference between jobs retained and number of UI claims. A positive value means that PPP allows for more jobs to be retained than were lost and layoffs were prevented. Conversely, a negative value suggests that PPP funding the sector was not able to offset all of the layoffs.
The New York sectors hardest hit by layoffs were accommodation and food services and retail trade. As New York State went on PAUSE on March 22, 2020, these establishments were required to close or significantly scale down their operations. Over 435,000 workers in restaurants and hotels filed for unemployment in the first 16 weeks of pandemic-related closures. Since PPP began, 25,761 establishments in the sector were awarded loans retaining 396,377 jobs. There are at least 39,000 New York workers who have not seen relief as a result of the PPP. According to the SBA, New York’s small business employment in this sector was 580,540; approximately 71 percent of the sector’s total employment. This suggests that the PPP program supported only 68 percent of the eligible workforce.
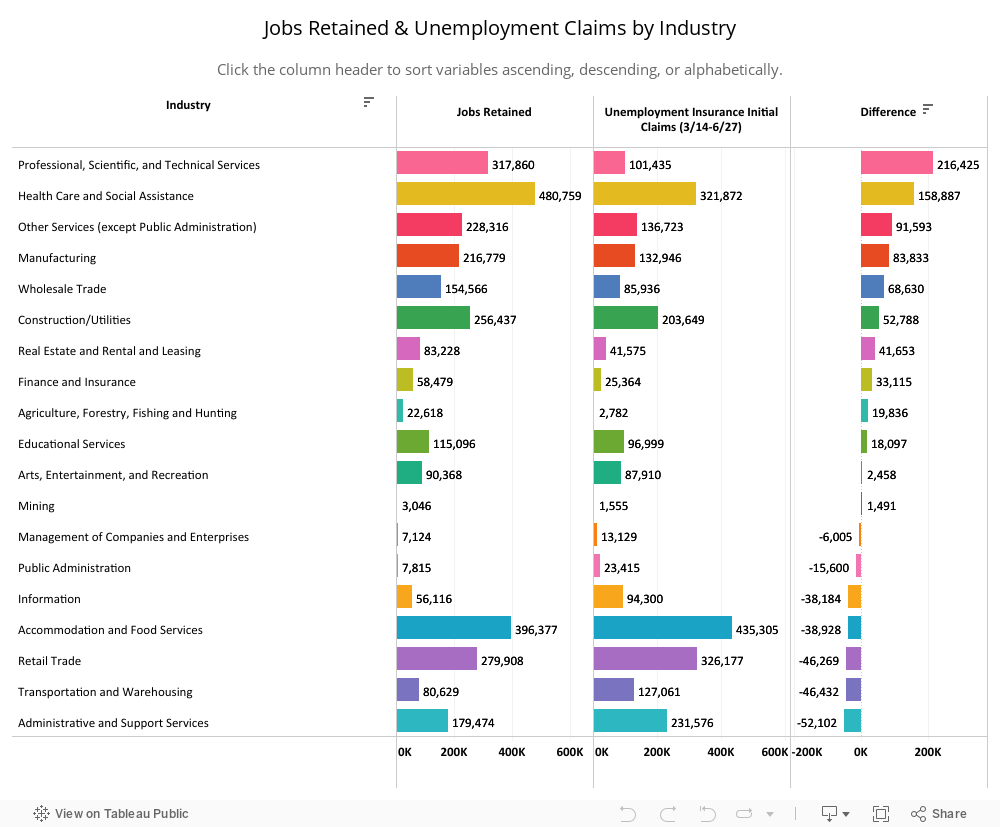
The retail trade sector was also significantly hit in the economic downturn with over 326,000 workers filing unemployment claims. In New York, 41 percent of the sector’s employees (380,939) work for small businesses. The PPP loans awarded in New York retained 279,900 or 73 percent of eligible jobs. There are at least 46,000 retail workers who experienced layoffs that could not be alleviated by the PPP. Almost 60 percent of workers in this sector were employed by larger companies that did not qualify for PPP suggesting the program was not as effective in supporting this industry.
Healthcare and social assistance was another sector hit hard by the COVID-19 economic downturn. As New York’s healthcare infrastructure turned its attention to the immediate crisis of COVID-19 treatment, medical offices closed for nonessential services and employees were furloughed or laid off. The social assistance sector also includes child day care services, which were impacted by forced closures. In the first months of the pandemic, 321,827 of workers in the healthcare and social assistance sector filed for unemployment. The sector is New York’s largest private employer accounting for 17 percent of the jobs in Q2 of 2019―and 38 percent of these workers are employed by small businesses. This is the sector in which the PPP had the largest impact. According to the SBA, the 32,447 loans granted retained a total of 480,759 jobs in the state. There were more jobs retained than lost suggesting that without the PPP, unemployment claims could have been significantly higher.
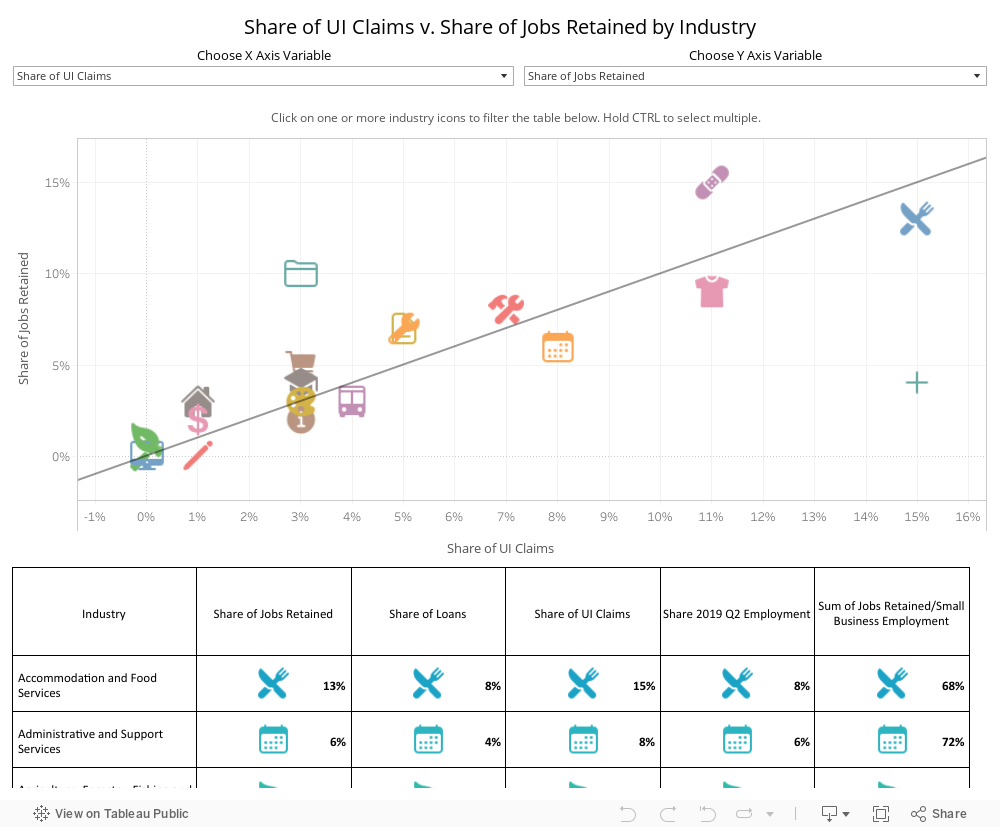
To determine which New York sectors were most successful in obtaining PPP funding, we can look at the number of jobs retained as a share of the sector’s small business employment. Overall, the PPP loans awarded in New York retained 3,162,720 jobs in small businesses across the state. This accounts for 77 percent of small business employment in the state (2017 levels). The larger the share, the more effective employers were in securing funding and maintaining payrolls. The sector with the greatest level of success was manufacturing. The number of jobs retained accounted for 90 percent of the sector’s small business employment. Firms in the sector of professional, scientific, and technical services were also successful in acquiring funding. This would include professional offices such as accounting firms and law offices.
The sectors that did not seem to be able to take full advantage of the program were finance and insurance, and management of companies and enterprises. Many of the businesses in these sectors had the flexibility to transition to remote work and were not immediately impacted by social distancing requirements. Less than 50 percent of eligible jobs received funding. These sectors also represented only a small portion of total layoffs in the state suggesting that perhaps firms in these sectors were not directly impacted by stay-in-place orders and did not pursue relief.
The figure below plots the relationship between the industry’s share of jobs retained and the share of unemployment claims. Industries above the line had a larger share of jobs retained than they had unemployment claims. These are the industries that had relatively more success in using PPP to offset potential furloughs. Professional and technical services, accounted for 10 percent of jobs retained and only 3 percent of unemployment claims. Healthcare and social services was also relatively successful, accounting for 15 percent of jobs retained through PPP compared to 11 percent of unemployment filings. Sectors below the line represent those who represented a greater share of job losses compared to PPP job retention.
Conclusions
The launch of the PPP allows observers of public policy and economics to observe the evolution of a policy in real time. The data released by the SBA confirms much of the reporting in April at the time the program launched. The first set of funding was granted to larger businesses who had the resources and connections required to prepare and file applications. The second round of funding reached smaller firms with lower payrolls. As a result the share of loans and funding awarded to businesses seeking less than $150,000 grew and the average loan size awarded fell by 75 percent. Eventually the program was able to reach the smaller businesses the support was intended for.
While it will be months before analysis can say with certainty that the PPP allowed businesses to retain jobs for the long term, an exploration of New York unemployment claims and PPP loans shows some sectors were successful in utilizing the PPP program to retain workers on payrolls. Professional and technical services and healthcare and social services, retained 375,000 more jobs than unemployment claims filed. These industries would have likely experienced more claims if employers did not have access to PPP. Sectors like transportation and warehousing, retail trade, and accommodation and food services had higher levels of unemployment claims than jobs retained. There are significant job losses in these sectors that PPP was unable to prevent. These sectors have several larger employers, however, and a smaller share of the sectors’ employment was eligible for PPP funding.
As COVID-19 and its economic impacts continue, policymakers are exploring additional relief measures. This includes additional funding for businesses with ongoing need that can demonstrate a reduction in revenue. There is also discussion of automatic forgiveness for loans below $150,000. As the program continues to evolve, it will provide a wealth of information on how to support businesses and workers in this unique economic climate and possible future economic downturns.
ABOUT THE AUTHOR
Laura Schultz is the executive director of research at the Rockefeller Institute of Government.