
November 1, 2018
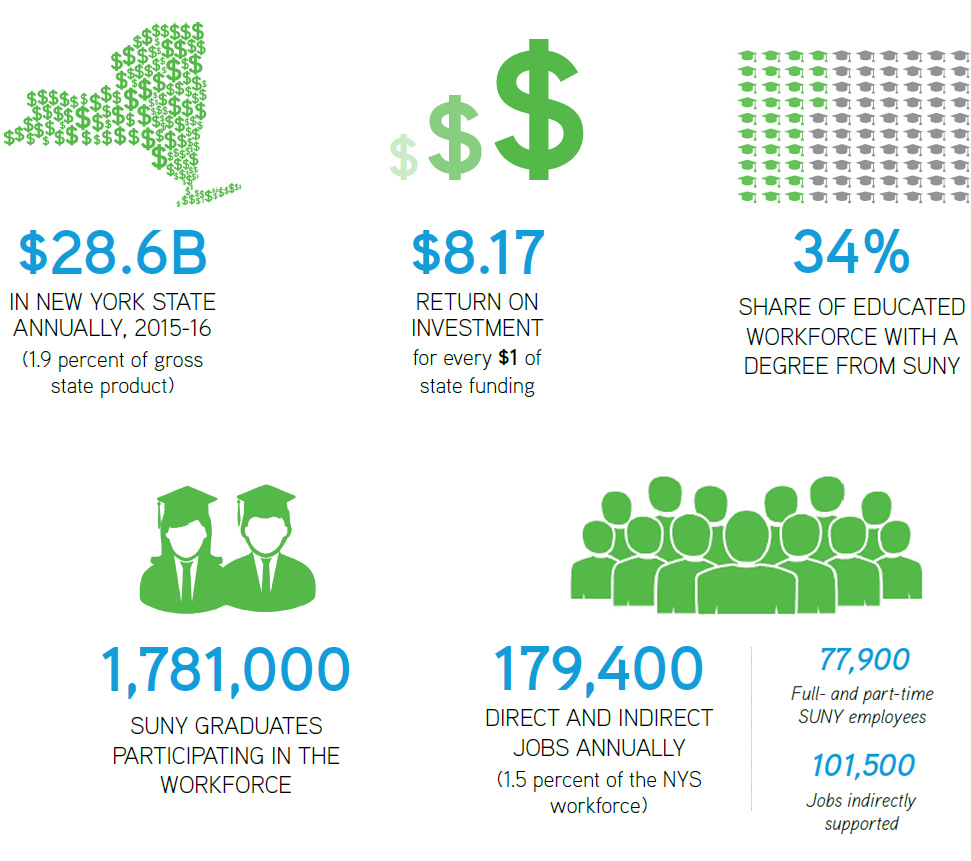
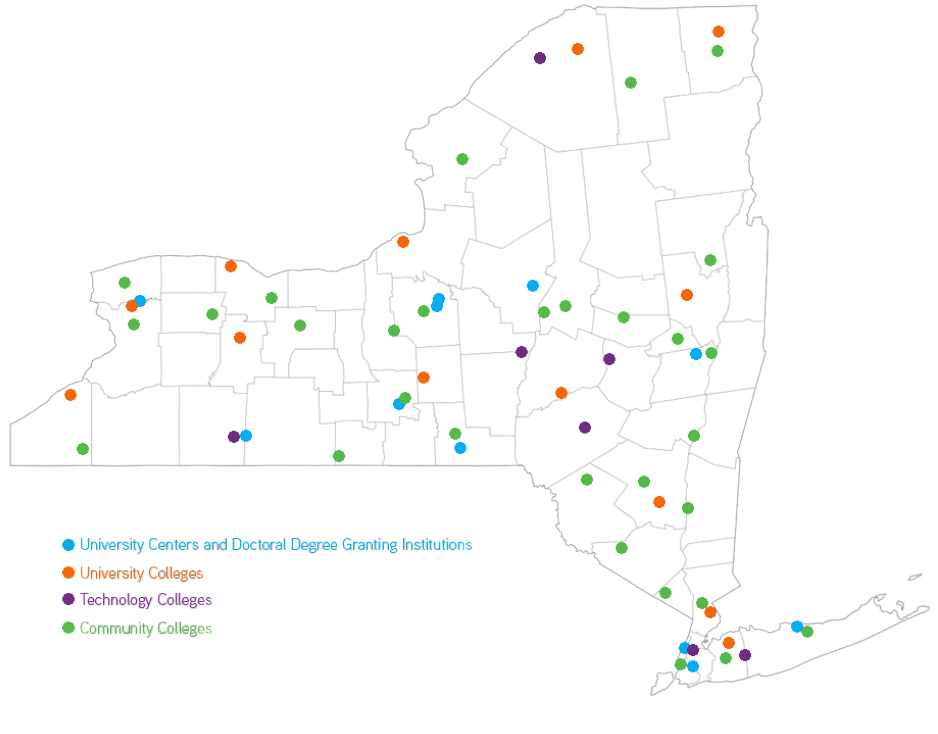
The State University of New York (SUNY) is one of the nation’s largest public systems of affordable quality higher education. What is the economic impact of SUNY as an employer and manager of sixty-four campuses and three hospitals across New York? What is SUNY’s overall contribution to the innovation infrastructure and labor force in New York? Simply put, SUNY is a key driver of the New York State economic engine. SUNY’s economic impact in New York State is $28.6 billion.[1] This represents a 27 percent growth in overall state economic impact since 2008.
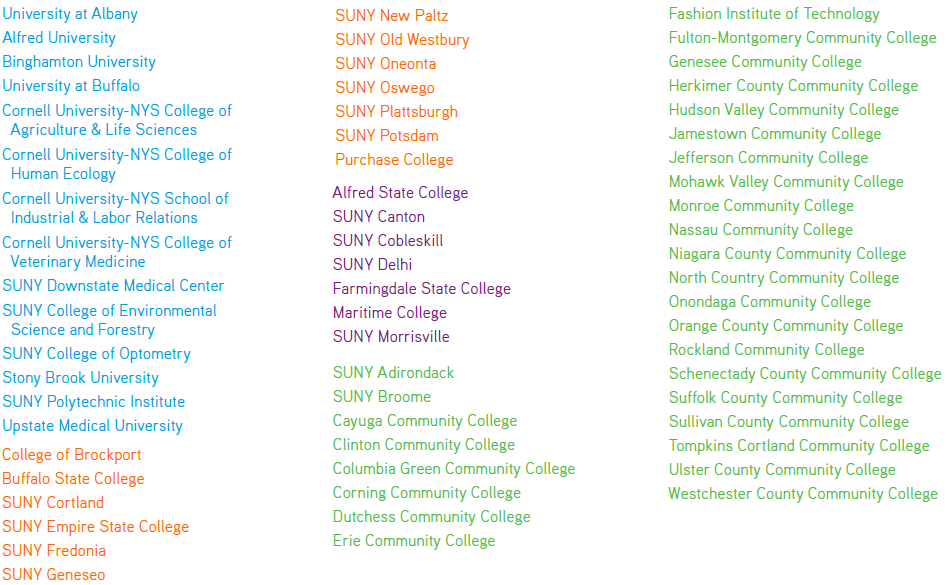
The SUNY system educates 436,277 students, employs 77,900 faculty and staff, and has an operating budget of $11.2 billion. To put this in perspective, if SUNY were a private company it would be among the ten largest employers in New York State.[2] The SUNY system includes community colleges, four-year colleges, graduate and research centers, medical schools and hospitals, a law school, and significant commercialization activities. These operations and student expenditures supported a total of 179,400 jobs through direct and indirect employment.
As a point of comparison SUNY’s impact for 2008-09 was $19.8B ($22.5B in 2018 dollars). The growth in impact has been driven by SUNY’s expanding hospitals and research activities, which now account for 43 percent of SUNY’s revenue.
SUNY’s impact flows through 81 percent (406 of 501) of industries active the New York economy. SUNY’s direct impacts are on the higher education, scientific research and development (R&D), and hospital industries where SUNY produces output, employs workers, and generates revenues. In addition, SUNY campuses and students create economic activity in a wide range of other industries as well. SUNY employees and students generate $2B in demand in the real estate industry across the state supporting almost 12,700 jobs. SUNY employees and students spend $825 million in food and drinking establishments supporting an additional 12,700 jobs. The SUNY community generates demand and supports employment at retail stores, doctor’s offices, wholesale traders, and hundreds of other industries in New York.
| Description | Employment | Output (In Dollars) |
| Colleges and universities | 65,041 | 9,606,408,730 |
| Hospitals | 8,232 | 3,411,407,421 |
| Scientific R&D services | 9,207 | 2,454,397,635 |
| Real estate | 12,671 | 2,071,103,829 |
| Restaurants and bars | 12,696 | 825,302,139 |
| Wholesale trade | 1,868 | 447,548,506 |
| Amusement and recreation | 4,863 | 310,531,498 |
| Retail – General merchandise stores | 2,824 | 207,547,198 |
| Employment services | 2,193 | 179,630,484 |
| Retail – Food and beverage stores | 2,122 | 142,743,691 |
We also analyzed the impact based on the New York State Regional Economic Development Council geographies. In every region of the state, SUNY plays a critical role in the local economies. The impact of all campuses in each of the ten regions was estimated and summed up to calculate the total impact of SUNY on New York State. The map below presents the economic impact SUNY has on each of the state’s regions. It also calculates SUNY’s relative importance to the regional workforce and output. SUNY employment places it among the top ten largest employers in every region in New York, excluding New York City.[3] The share of workforce shows the percentage of the region’s jobs directly and indirectly supported by SUNY’s economic activities. SUNY’s impact in direct employment and jobs supported is greatest in Western New York and Long Island.
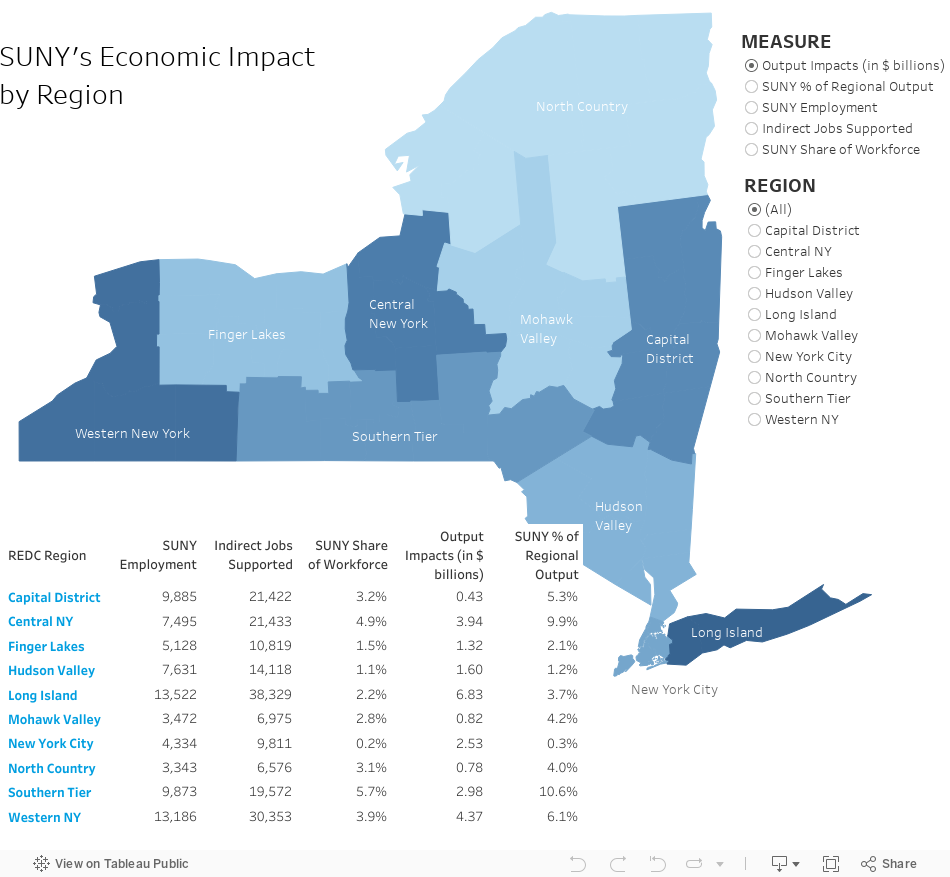
SUNY plays an important role as a regional employer. SUNY’s largest impact is in the Southern Tier where it accounts for 6 percent of regional employment and 11 percent of total output. SUNY is also an important driver in the Central New York economy, accounting for 5 percent of employment and 10 percent of economic output. Overall, SUNY accounts for 2.8 percent of upstate employment and 4.4 percent of upstate NY output.
SUNY takes on leadership positions in New York’s regional economies and has been deeply involved in the New York State economic strategy over the past eight years. SUNY presidents serve on nine out of ten of the NY Regional Economic Development Councils (REDCs) and co-chair seven of the leadership teams. This is a nod to the critical role campuses play in supporting economic development. Campuses train workers, offer resources to emerging and relocating companies, and serve as an important attraction when regional leaders look to plan for the future.
New York is one of the most innovative states in the country. It ranks second nationwide in number of science and engineering graduate students, PhD recipients, and employed doctorates. In 2016, New York colleges and universities performed $5.8B in research, ranking second nationally in academic R&D performance. SUNY campuses reported $1.3B in research expenditures, or 22 percent of New York’s academic R&D.[4] New York ranked thirds in academic research space (15,639,000 square feet). All of these key metrics show that New York is home to a very productive innovation ecosystem.[5] SUNY’s robust research, development, and commercialization activities are also essential to the economy.
SUNY performs research and training of workers that serve as the foundation of New York’s innovation economy. SUNY’s research grant arm, the Research Foundation, manages a portfolio of $920M in sponsored research grants and funding annually, which SUNY turns into economic impact through commercialization. SUNY campuses actively work to transfer the technology from the labs to the New York economy. SUNY’s 2016 patent portfolio includes 306 invention disclosures, 236 patent applications, and 68 awards annually. The Research Foundation and campus work with faculty, students, and local entrepreneurs to launch companies.
There are currently ninety-three active start-up companies in New York that are licensing SUNY technologies to create jobs and economic output.[6] SUNY is also actively supporting additional emerging high-tech companies through a portfolio of programs that provide entrepreneurs with access to SUNY innovation resources. In 2016, eighty businesses partnered with thirty-six SUNY campuses as part of Start-UP NY.[7] The results included internships and job offers for SUNY students, new research collaborations with faculty, and revenue generated for campuses. SUNY campuses are home to seven NYS Empire State Development’s Division of Science, Technology and Innovation (NYSTAR) Centers of Excellence.[8] These research centers foster collaborations between SUNY researchers and New York businesses to help them develop and commercialize new products and technologies. SUNY campuses across the state also assist emerging businesses through six Empire State Development Corporation[9] and four NYS Energy Research and Development Authority (NYSERDA)[10] incubators created to offer early-stage New York State companies assistance with technology and business validation and development.
| Generating Discoveries: | Launching High-Tech Companies: | |||
| 68 patents awarded | 66 licenses executed | |||
| 236 patent applications | $10.7M in licensing income | |||
| 308 invention disclosures | 13 spin-offs created this year and 93 operational |
SUNY plays a critical role in the development of talent in New York State. Thirty-four percent of the workers in New York with a postsecondary degree earned a credential from SUNY. Degree completion translates into economic impact. SUNY alumni earned $110B, or 16 percent, of all payroll earned by New York employees in 2016.
New York has one of the largest and best educated workforces in the US. With almost 5,000,000 college-educated residents, New York ranks third in the US for total number of bachelor’s degrees.[12] Better-educated workers have higher levels of productivity, which is critical to attracting existing firms and promoting entrepreneurship. The end result of an educated workforce is higher levels of economic output. In 2017, New York had the third highest gross domestic product (GDP) in the US. To maintain economic dominance, New York must continue to produce and attract highly educated workers.


SUNY plays an important role by providing a constant supply of educated employees for New York-based employers. In 2016, 36 percent of all students enrolled in New York were attending SUNY institution.[13] In comparison, 17 percent of students were enrolled at a City University of New York (CUNY) campus and 47 percent at an independent college or university. In 2016, SUNY awarded over 96,000 degrees. SUNY awarded 54 percent of associate’s degrees, 30 percent of bachelor’s degrees, 15 percent of master’s degrees, 25 percent of PhDs, and 16 percent of the professional doctoral degrees conferred in New York State.[14] Over the past forty-five years, SUNY has awarded over 3.2 million degrees to approximately 2.7 million individual alumni, many of whom are active in the New York workforce.[15]
In recent years, data-sharing agreements have enabled the linking of SUNY administrative records to the New York Department of Labor data. This allows researchers to answer questions about how SUNY graduates as employees. Based on these data, we estimate 66 percent of SUNY alumni who graduated in the last forty-five years are currently participating in the New York State workforce.[16] Table 2 shows the number of SUNY graduates working in New York by their highest level of educational attainment. Over a third of workers in New York with a postsecondary credential earned at least one degree from a SUNY campus.
| Associate's | Bachelor's | Master's | Doctoral | Professional | |
| SUNY Graduates in NY | 563,000 | 633,000 | 476,000 | 52,000 | 57,000 |
| NY Workforce Total [18] | 1,022,000 | 2,416,000 | 1,287,000 | 318,000 | 189,000 |
| Share with a SUNY Degree | 55% | 26% | 37% | 16% | 30% |
| SUNY’s Share of NY Degrees Awarded (2016) | 54% | 30% | 15% | 25% | 16% |
To get a better idea of how SUNY contributes to the New York State workforce, we take a closer look at the students who graduated in 2006 with bachelor’s degrees. To get a sense of how workforce participation varies by field, we examine ten of the most popular fields of study in 2016 presented in order of popularity. The ten fields account for 78 percent of all degrees awarded that year by SUNY.
| Working in NY (Two Years) | Working in NY (Ten Years) | |
| Business, Management, Marketing | 78% | 62% |
| Education | 84% | 73% |
| Social Sciences | 76% | 64% |
| Psychology | 80% | 65% |
| Visual and Performing Arts | 72% | 57% |
| Health Professions and Related Clinical Sciences | 82% | 71% |
| Communications, Journalism | 81% | 65% |
| Biological and Biomedical Sciences | 65% | 54% |
| English Language and Letters | 79% | 62% |
| History | 80% | 68% |
Two years after graduation, 78 percent of all 2006 SUNY bachelor’s graduates were working in New York State. After ten years, that number fell to 64 percent. Graduates with education degrees are the most likely still to be in New York immediately after graduation and a decade later (84 percent and 73 percent, respectively). Graduates of health professions programs are also very likely to remain in the state after graduation. Alumni with degrees in biology were the most likely to leave the state with barely half still participating in the workforce after a decade.
The linking of student and employment records offers great potential for understanding the economic impact of SUNY on New York. These data will allow us to understand how SUNY graduates move into New York’s industries, the effectiveness of SUNY at meeting the demand of New York’s employers, and how a SUNY degree impacts earnings. The Institute will be partnering with SUNY in the near future to provide detailed analyses of SUNY and the New York workforce.
This analysis studied spending associated with state operations at each campus, SUNY administrative offices, and the SUNY Research Foundation and off-campus spending by students.[19],[20] The focus is the academic year 2015-16. All campus-level financial data were collected from the IPEDS data repository. Supplemental data were provided by SUNY Institutional Research. Research Foundation payroll was collected from seethroughny.net. Student spending was estimated based on data from the SUNY Net Price Cost Calculator. The multiplier analysis was performed with the IMPLAN economic modelling tool.
Approximately 18 percent of SUNY’s revenues come from out-of-state sources including federal grants and contracts, and tuition, fees, and room and board paid by out-of-state students.
SUNY attracted $10.6B in revenues from a range of public and private sources:
+ $1.6B in tuition and fees
+ $3.4B in auxiliary service sales (room and board, hospitals)
+ $3.5B in NYS appropriations, grants, and contracts
+ $1.1B in federal appropriations, grants, and contracts
+ $0.9B from other sources
Most of SUNY’s spending is on wages and benefits for its employees:
+ $11.2 B in SUNY spending
+ $8.7B on employee wages and benefits
+ $2.5B other institutional purchases
+ $1.4B by students
[1] The economic analysis was completed for the academic year July 2015-June 2016
[2] “New York’s Largest Private Sector Employers,” NYS Department of Labor, accessed September 20, 2018, https://labor.ny.gov/stats/nys/Largest-private-sector-employers-NYS.shtm
[3] Ibid.
[4] Calculated as a sum of SUNY Higher Education R&D Expenditures for SUNY Campuses. See “Rankings by total R&D expenditures,” National Science Foundation, accessed September 20, 2018, https://ncsesdata.nsf.gov/profiles/site?method=rankingBySource&ds=herd
[5] National Science Foundation: Science and Engineering State Profiles. Available at: https://www.nsf.gov/statistics/states/
[6] Statistics for FY 2015-16 are from “Key Performance Indicators,” SUNY RF: The Research Foundation for the State University of New York, accessed September 20, 2018, http://www.rfsuny.org/Our-Work/Key-Performance-Indicators/
[7] https://www.suny.edu/media/suny/content-assets/documents/research/START-UP_NY-SUNY-ProgressReport-2017.pdf
[8] “Centers of Excellence,” NYS Empire State Development, accessed September 20, 2018, https://esd.ny.gov/centers-excellence
“New York State Certified Business Incubators and Innovation Hot Spots,” NYS Empire State Development, accessed September 20, 2018, https://esd.ny.gov/certified-business-incubator
[10] “Clean Energy Incubators,” NYS Energy Research and Development Authority (NYSERDA), accessed September 20, 2018, https://www.nyserda.ny.gov/Partners%20and%20Investors/Clean%20Energy%20Startups/NYSERDA%20Supports%20Growth%20Essentials/Clean%20Energy%20Incubators
[11] “Key Performance Indicators.”
[12] American Community Survey
[13] 2016 Enrollment, “ORIS Reports,” NYS Education Department, last updated August 22, 2018, http://www.highered.nysed.gov/oris/ORISReports1.html
[14] “IPEDS: Integrated Postsecondary Education Data System,” National Center for Education Statistics, accessed September 20, 2018, https://nces.ed.gov/ipeds/
[15] For the purpose of this discussion, we are focusing on associate’s, bachelor’s, master’s, PhDs, and professional doctorates. Undergraduate and graduate certificates are excluded.
[16] Workforce participation for all New Yorkers with a postsecondary degree is 75 percent.
[17] Workers are traditionally classified by their highest level of educational attainment. We used data from SUNY and the National Student Clearinghouse to predict the final level of educational attainment for SUNY alumni. A graduate who earned a bachelor’s degree from SUNY and a master’s degree from a private school is categorized in the workforce as a master’s degree.
[18] “Current Population Survey (CPS),” United States Census Bureau, accessed September 20, 2018, https://www.census.gov/programs-surveys/cps.html
[19] Analysis used the latest available data, which was from the July 2015-June 2016 academic year. This growth in SUNY’s economic impact is being driven by the larger portion of SUNY revenues being generated from research and development and hospital services. As a point of comparison, SUNY’s impact for 2008-09 was $19.8B ($22.5B in 2018 dollars). See How SUNY Matters: Economic Impacts of the State University of New York (Albany: Rockefeller Institute of Government and Buffalo: Regional Institute, University at Buffalo, June 2011), http://rockinst.org/wp-content/uploads/2018/02/2011-06-01-How_SUNY_Matters.pdf
[20] This analysis does not include expenditures or economic activity by affiliated university associations, foundations, partner companies, or start-ups operating independently on campuses. The analysis focuses on operational spending of campuses and does not include capital investment or construction spending. Spending by visitors, retirees, and alumni are not included in the multiplier analysis.
Laura Schultz is director of fiscal analysis and senior economist at the Rockefeller Institute of Government