
October 2017
he attention given to staffing schools with qualified teachers is understandable and critical exercise. In education, teachers are the heart of the matter, as studies of learning and life outcomes show. Concerns about teacher shortages, therefore, correspond to concerns about learning — and life — opportunities for children and young adults. This is as true in South Dakota as it is in New York, Mississippi, New Mexico, and every other state. In 2015, the South Dakota Department of Education prepared a report for the Governor’s Blue Ribbon Task Force on Teachers and Students, which suggested that South Dakota had a surplus of teachers at the state level.
1 A 2016 report, A Coming Crisis in Teaching? Teacher Supply, Demand, and Shortages in the U.S. also showed survey data indicating that South Dakota was a stable and attractive place for teachers.
But when you look at the state in comparison to national trends, it differs in important ways; and when you look within the state, there are big and systematic variations in teacher turnover, vacancies, and measures of teacher quality. Our preliminary findings are:
These preliminary findings are only a snapshot of the most recent patterns. But they underline the importance of seeing the teacher workforce in a more detailed, granular way. It is changing; the changes and challenges vary from state to state; and the differences within the state suggest that there’s a need to target efforts to secure a more stable, better qualified teacher workforce. National trends are interesting, but they do not establish priorities that will do the most good. In the next phase of our study, we will examine teacher-level data for more detailed analysis.
Access to a quality teacher could be one of the defining factors of whether a student excels or struggles. Teaching is one of our society’s noblest professions. That is why it is critical to strengthen our teaching pipelines and elevate the profession. In order to meet this challenge, policymakers must understand the challenges that schools and teachers face across the country as well as the need and challenges schools face in recrutitng and retaining quality educators.
An emerging issue has centered on whether there is a coming national teacher shortage. Although spoken in national terms, education is a highly localized process in which teacher “supply” and “demand” often vary dramatically from community to community. In one community, there could be a significant shortage or any teachers and in the community right next door could have a surplus of educators to chose from — and these circumstances can change quickly over time.
The Great Recession caused massive disruptions in our economy across all industries and sectors, and education was not spared. It could have been worse, if the federal government did not infuse billions of dollars into states to stave off massive layoffs to educators across the country. Yet, teachers did lose jobs, graduates of education programs found themselves jobless upon graduation, and others faced a weak and constrained job market.
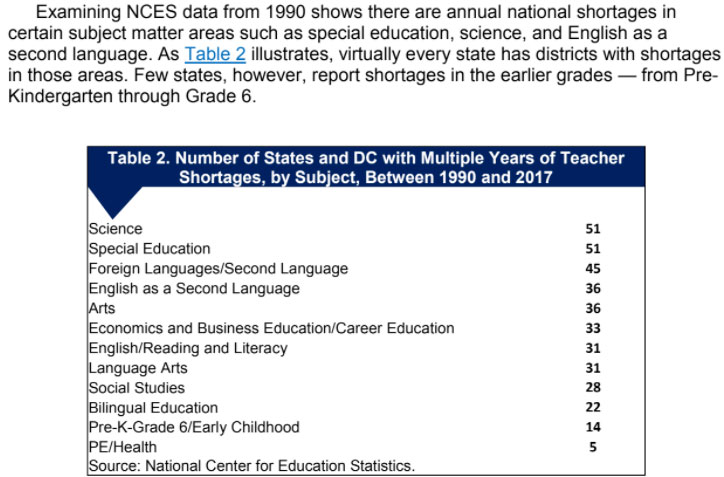
However, with the economic rebound and a wave of retirements (among other factors), there have been numerous studies suggesting the emergence of a large-scale teacher shortage nationally.3 However, demand for teachers varies over time, by state, locality, grade level, and specialization. Those holding teacher qualifications available to fill open positions also vary. Whether or not there is an overall national shortage of teachers says little about the difficulties (if any) faced by particular school districts and states in filling hiring needs. This underscores the need to have timely, granular data on the supply and demand for teachers.
If one is truly serious about addressing teacher supply and demand issues, analysis must be done at the local level. Therefore, working with the South Dakota Department of Education, we have begun collecting data to pinpoint where potential shortages and turnover of teachers are as a way to lay the foundation of targeted solutions in specific areas. Given the data collection process, we have broken the study into two phases:
Thereafter, working with our other partners, we will survey teachers to get a sense of the problems they face, which at times make them exit the profession, or leave certain school districts for others.
Before delving into the analysis, there is a need to help readers understand what we define as a teacher “shortage.” Shortage, as used here, refers to an imbalance between the demand for the qualified teachers needed in schools and classrooms and the available supply of qualified teachers to fill such posts. It follows that an increase in the number of posts to be filled need not give rise to a shortage, if the number of qualified applicants is sufficiently large. Similarly, a decrease in the available supply of qualified teachers may not give rise to a shortage, if the number of posts to be filled is low. Imbalances may emerge by grade level, specialization, and location. Further, hiring needs may evolve owing to the demographics and dynamics in state and local economies that drive both the demand for teachers and the available supply.
In this initial analysis, our focus is on the indicators of potential shortages as conveyed in a recent, one-year snapshot. In this initial report, we also rely on an incomplete version of demand, one that focuses on replacement — turnover and vacancies — in current positions. A more complete version would encompass teacher demand stemming from changes in school enrollments and program changes, but we have not yet obtained the local-level data to measure these aspects of the labor market.
We hope to address these in the final report. The final analysis will also integrate teacher demand and supply and examine the ever-changing dynamics of these processes. This report lays out some of the challenges and opportunities districts face filling positions. It does not offer policy prescriptions but suggests some directions for consideration, based on our preliminary findings.
This brief report reveals these variations for one state, South Dakota, and indicates clearly the extraordinary variation in the teacher workforce even within a small, comparatively homogenous state. South Dakota has 149 school districts with 9,350 teachers and approximately 131,000 students. It has a large Native American population with several large tribal territories. The South Dakota public school system has three city school districts, and then primarly rural distrcits across the state. The current national data show historic shortages in areas such as special education and math, and in certain geographic locations, like rural and inner city urban communities.
Notwithstanding longstanding difficulties in recruiting in many school districts, an understanding of the problem requires not only a state-by-state analysis but more micro-level district-by-district or even school-by-school investigations. As teacher labor markets are often “local,” shortages in some regions co-occur with surpluses in others.
The South Dakota Department’s report for the Governor’s Blue Ribbon Task Force on Teachers undertook a careful descriptive analysis of a number of the kinds of changes that likely would influence the evolution in hiring needs alongside likely trends in the available supply. The analysis leads to projections that the supply of qualified teachers newly making themselves available to teach will more than match the hiring needs statewide.
The descriptive analyses presented in this report provide a preliminary, first look at teacher shortages at district-level in South Dakota. In this way, the analyses give attention to a further dimension of potential shortages, namely by locality. The intent is to provide a more finely grained, if limited, assessment of indicators of teacher shortage. The analyses rely on readily available information for public school districts, bringing together data on teacher characteristics, school characteristics, and student characteristics and performance. Such information is routinely assembled by the South Dakota Department of Education, and presented along with other data from separate data collections, on the Department’s website.
The report relies on two indicators of potential shortage: teacher turnover and vacancies. Teacher turnover refers to teachers who vacate their posts (and so, other things equal, give rise to a hiring need in the current year). As noted, a good share of these teachers take up positions in other public school districts, and so are not lost to the state as a whole. The district, however, has the hiring need. Vacancies refer to positions posted for hiring that are not filled at the beginning of the school year.
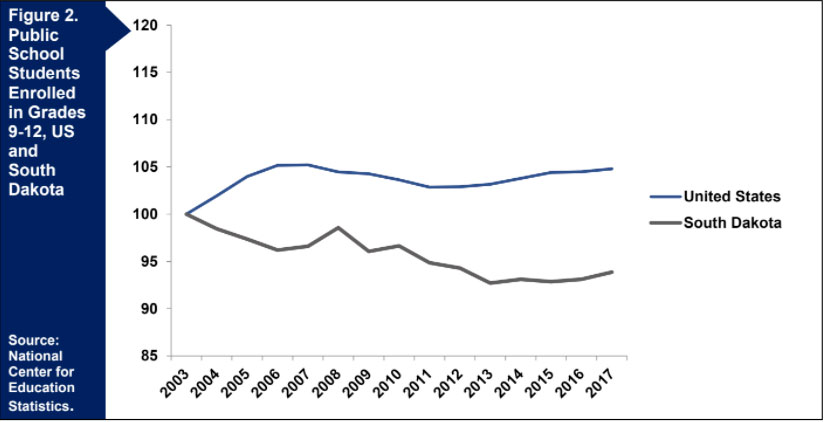
Nationally, since 1970 the number of teachers has increased 51.9 percent, while the number of students has increased 9.5 percent.5 On the whole, this trend has lowered student-teacher ratios across the country to around 16:1. But individual states can experience different dynamics, and in this report, we show developments and patterns in South Dakota. While we do not yet have data for this entire period for South Dakota, the state’s last decade has shown very different changes. Student growth has exceeded growth in the teacher workforce. The number of K-12 students in South Dakota grew by 8.9 percent between the 2006-07 and 2015-16 school years, while the number of teachers increased only by 4.7 percent (see Appendix B).
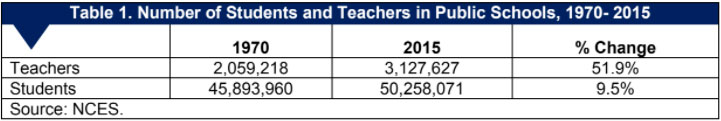
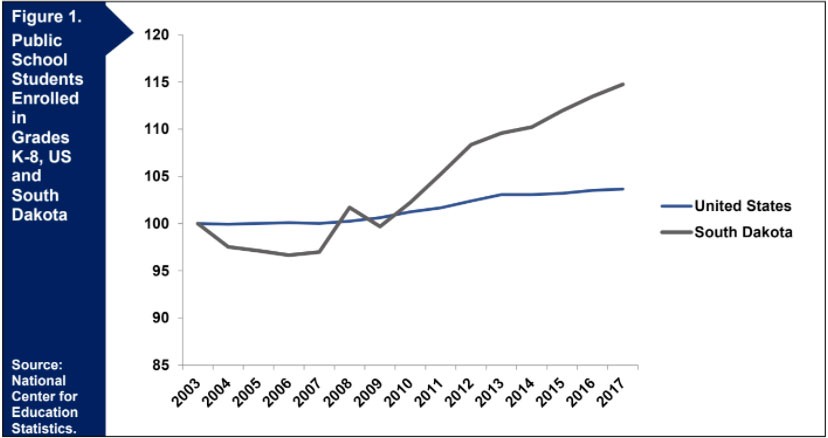
South Dakota diverges from the national trends in other ways. On the demand side, public student enrollments in the US have changed little in recent years. After enrollment growth between 1986 and 2007 of 26 percent, recent numbers have been flat, though estimates by the National Center for Education Statistics (NCES) show small yet steady growth in enrollments between 2016 and 2025. By contrast, South Dakota has seen sharp increases in its enrollments, and unlike the case at the national level, the recent growth has been particularly strong among younger children — in grades kindergarten to eighth grade.
Patterns of Teacher Shortages and Turnover Vary Across Subject Areas, Differing Considerably at the National Level and South Dakota
As one might expect, South Dakota has faced different workforce issues across teacher specializations and grade levels. While we do not have a survey of districts and schools within South Dakota that asked administrators about their perceptions of teacher shortages, the South Dakota Department of Education makes data available on teacher turnover and vacancies at the district level. To be sure, there are many reasons for teacher turnover and vacancies that do not indicate shortages, but both measures indicate hiring needs, and high levels of turnover may suggest a system-level shortage, either in the availability of, and competition for, teachers, or in the difficulty of hiring and retaining high-quality teachers. Although we will use additional measures of the teacher workforce in this initial analysis — including quality measures such as experience, certification, and graduate degrees — most of the analysis will focus on turnover as a measure of labor demand.
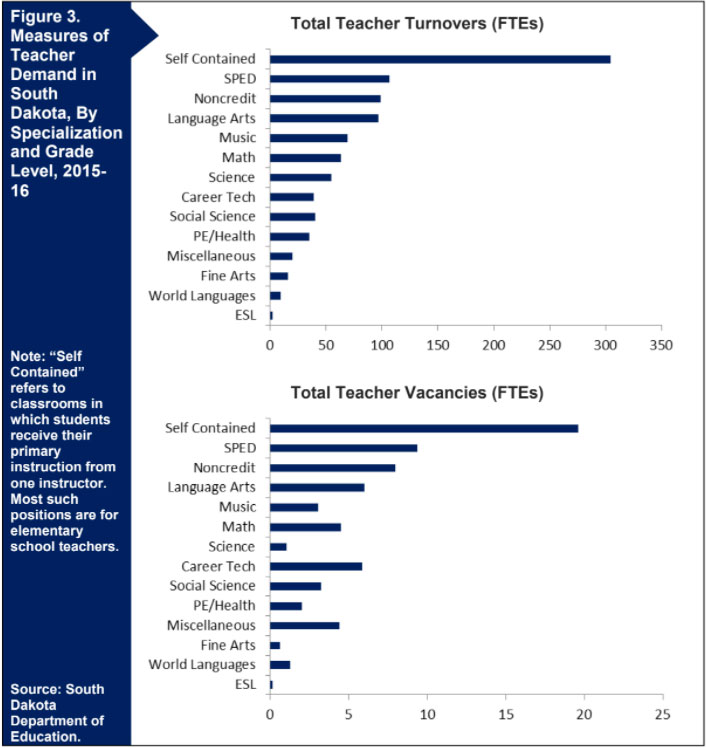
When we use these measures of teacher demand within South Dakota, we find a different profile of needs (Figure 3). Like the nation as a whole, special education generates considerable demand, as indicated both by the total number of turnovers and the number of vacancies in the fall after the start of the school year. However, unlike the situation at the national level, there is even greater demand in South Dakota for “self contained” positions, largely elementary school classroom positions where students receive their primary instruction from one instructor. Also in contrast to the national picture, science teachers are not among the high-demand positions, nor is there demand for ESL positions or foreign languages. Art teachers are also in low demand in South Dakota, although at the national level they seem to be in comparative shortage.
There are surely many reasons for these differences, and some are obvious. South Dakota does not have as many ESL students as many other states do, and the states’ districts may offer curricula that emphasize different subject areas than elsewhere. We will look into these questions as we work toward a final report. But the basic point is a simple one: while it is interesting perhaps to discuss a national teacher shortage or national teacher needs by specialization and grade level, those national patterns may have little meaning for individual states. If one wants to understand teacher demand as well as supply patterns and dynamics, it is essential to do the work on a state-by-state basis.
Chronic Staffing Problems Persist in South Dakota Schools with Many Poor and Minority Students — and in Schools Located in Small, Rural Communities Even more important than recognizing differences among states, school districts within states vary greatly in their demand for teachers. These district-level variations are associated with a number of district characteristics — differences that are often interrelated. In South Dakota, demand is greater in districts with higher rates of child poverty, with high proportions of Native American students, with lower average teacher salaries, and, most of all, with rural, small population districts.
In phase one, we focus our analysis of teacher demand on teacher turnover within an academic year (2015-16). Vacancies are of course an even stronger indicator of unmet demand and, as Figure 5 shows, they demonstrate a pattern across specializations that is similar to what we see for turnover. Vacancies, however, are uncommon in South Dakota, at least for this year, and their lack of variation makes it difficult to seen any patterns across districts, though they generally reinforce the variations we note below.
Also, while Figure 3 shows turnover (and vacancies) in total full time equivalents (FTEs) across districts, when we examine differences among districts, we standardize the turnovers with respect to each district’s total teacher workforce. That is, we divide the number of turnovers (in FTEs) by the total number of FTEs in the district.
Standardization helps us see the turnover issue from the perspective of districts of different sizes. In a small district, a couple of resignations and retirements may be a challenge, while in a large district they may be an easy and typical lift.
Turnovers do in fact vary across districts. Figure 4 shows this variation by indicating the number of districts that fall in different turnover rate intervals. About half of the districts experienced turnover rates lower than 0.10; in these districts, less than one out of ten positions (in FTEs) underwent turnover in the academic year. But some districts reported much higher numbers relative to their workforces.Indeed, seventeen districts had to replace over one-fifth of their teaching workforce in a single year.
Somewhat surprisingly, the differences in teacher turnovers are not substantial or consistent with respect to child poverty in the district. The top of Figure 5 shows the average (mean) turnover rates across districts in three categories: those with child poverty rates less than 10 percent, those with child poverty rates between 10 and 20 percent, and those whose poverty rates are greater than 20 percent. Although districts with child poverty rates greater than 20 percent are typically higher than the averages in districts with lower levels of poverty, the differences are not significantly different, and the districts with child poverty rates between 10 and 20 percent indicate slightly less turnover than districts with lower poverty levels.
We see greater and more consistent differences when we compare districts with different proportions of Native American students (also in Figure 5).
Turnover averages only slightly more than one-tenth of an FTE in districts with less than 5 percent Native American students. In districts where more than half of their students are Native Americans, however, turnover averages about 50 percent higher, where about one out of six full time teachers had to be replaced in a single year. We should note that the turnover rate is even higher among the small number of districts with over 75 percent Native American students — nearly one out of five FTEs turned over.
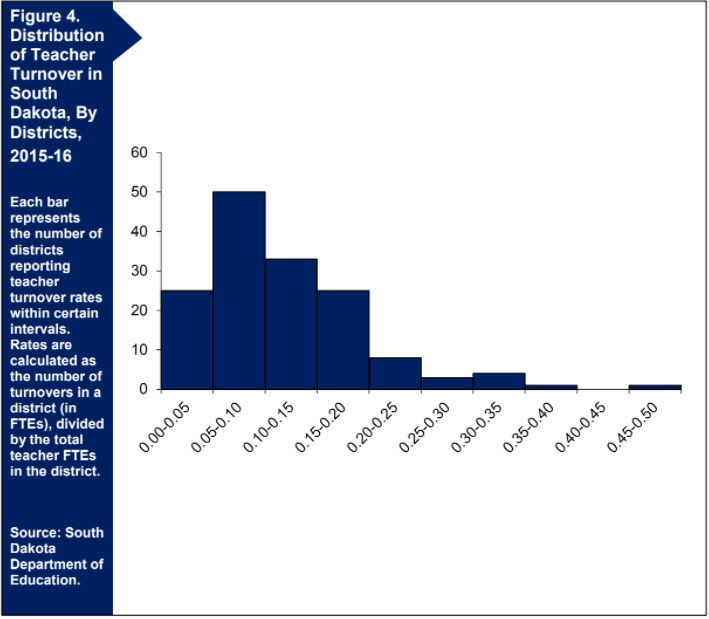
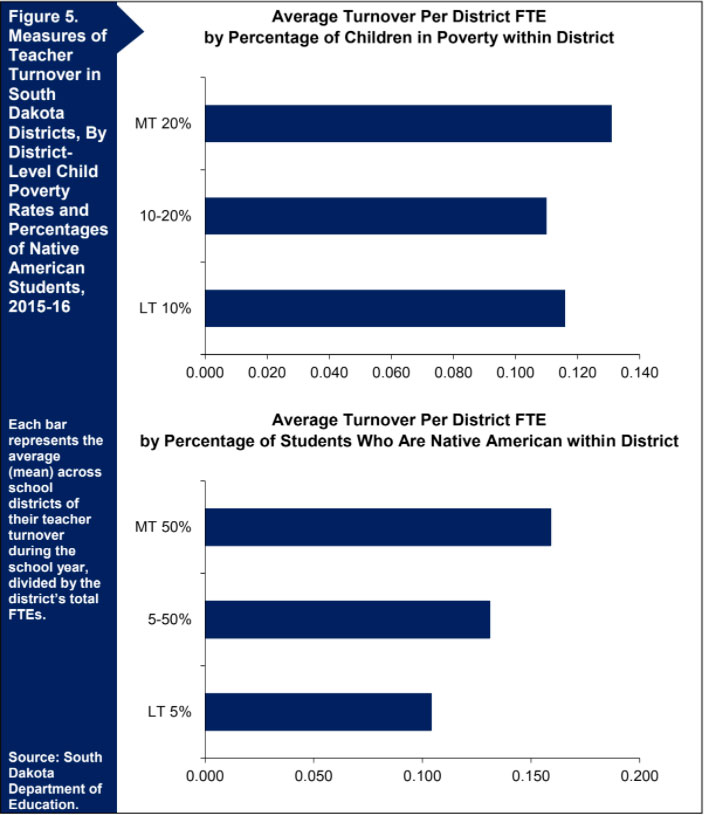
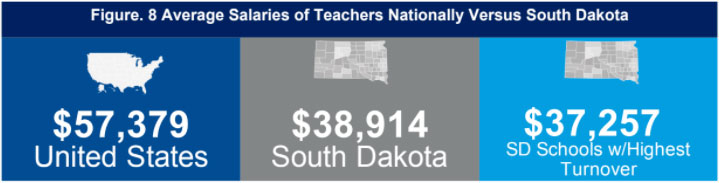
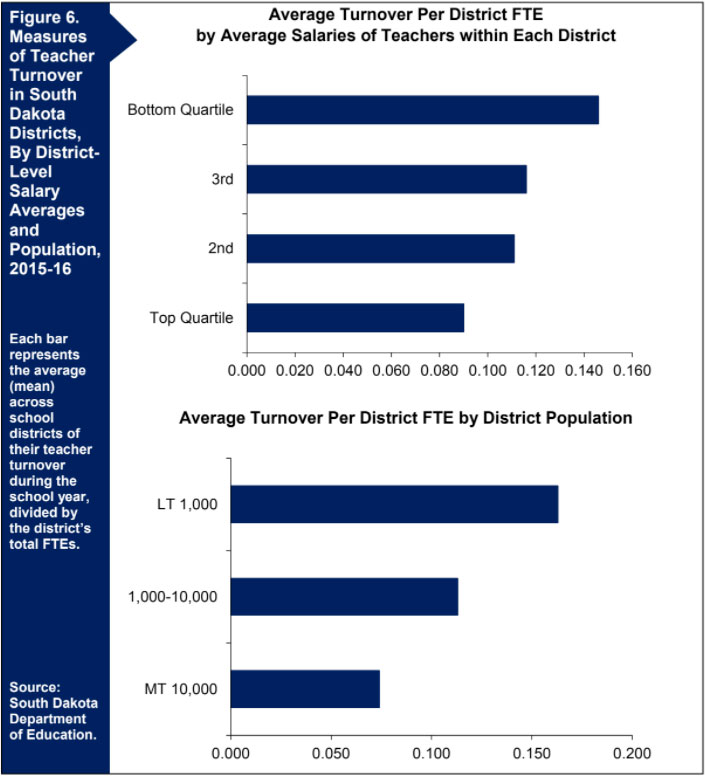
Figure 6 shows that turnover rates vary with other important characteristics of school districts. The top of Figure 6 shows the differences in turnover rates by average salaries of teachers within each district. The four categories of teacher salaries are quartiles, that is, the lowest 25 percent of district salaries, the next highest 25 percent (topping out at the median district salary in the state), and then the next two highest 25 percent of districts arranged by their average teacher salaries. Average district salaries don’t vary greatly in South Dakota, nor are they high by national standards. The median salary is $38,716, and the 25th and 75th percentile salaries are $36,782 and $40,730, respectively.
Nonetheless, turnover rates are consistently associated with average district salaries. Districts in the top quartile of salaries saw, on average, turnover in about one out of eleven positions, while districts in the lowest quartile experienced turnover in nearly one out of seven FTEs. In the middle salary quartiles, turnover differences were in between these two rates.
All of these variations, however, are not nearly as striking as the differences between districts of different populations, as revealed in the graph on the bottom of Figure 6. South Dakota districts are generally quite small. The median district’s total population is only about 1,900, and even the 90th percentile of districts in terms of size is just over 12,600. The approximate population of school-age children (5-17) is only 346 in the median district and 1,321 in the 90th percentile.
But size is significant even within this relatively narrow range. We divided the districts into three categories: those with total populations less than 1,000 (21 districts), those whose populations ranged between 1,000 and 10,000 (114 districts), and those with populations greater than 10,000 (16 districts). As Figure 6 shows, districts with different populations vary greatly in their turnover rates. Districts with the largest populations show a turnover rate of 0.07, or about one out of 14 FTEs requiring replacement every year. The smallest districts, however, saw turnover rates of 0.16, more than twice as high the largest category. In the smallest districts, about one out of six teachers (in FTEs) needed replacement in a single year.
Some of these differences are certainly to be expected, based on the math alone. In very small districts, a single departure creates a high rate. But that is not the only thing going on when we look at the variation within the population categories. The high turnout rates also occur in districts with significant workforces but in small districts, not just in the tiniest of districts. Nonetheless, we plan to look more closely at the data in phase two, when we can examine turnovers over many years. A few turnovers in a single year would be a challenge in small districts, but it would pale in significance to a persistent pattern of turnovers.
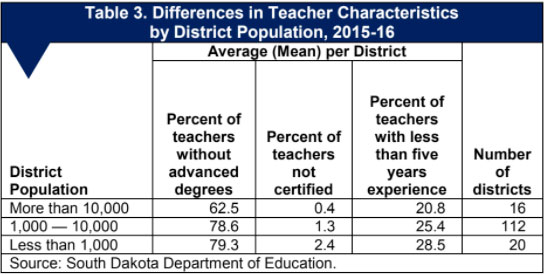
Also, other measures of teacher workforce challenges reinforce these findings with respect to the challenges faced by small, rural districts. Table 3 shows three indicators of the difficulties small districts face in staffing strong, highly qualified teachers. The smallest school districts — those with total populations less than 1,000 — are more likely to have teachers without advanced degrees. They also have higher proportions (albeit still small) of teachers that are not certified. Finally, they are more likely to have teachers who have less than five years of experience, a point at which many teachers begin to reach their peak performance, as measured by much of the research.
Although the smallest districts face, on average, greater challenges in their teacher workforce than those in districts with larger populations, we should also note that there is still great variation among these rural districts. This variation offers an opportunity to understand how different districts — even those confronting considerable difficulties in managing teacher positions — handle those challenges. Thus, not only is it important to look at the teacher workforce dynamics at the state and district levels, it is also important to look at differences among certain types of districts and schools, especially those dealing with the most difficult situations.
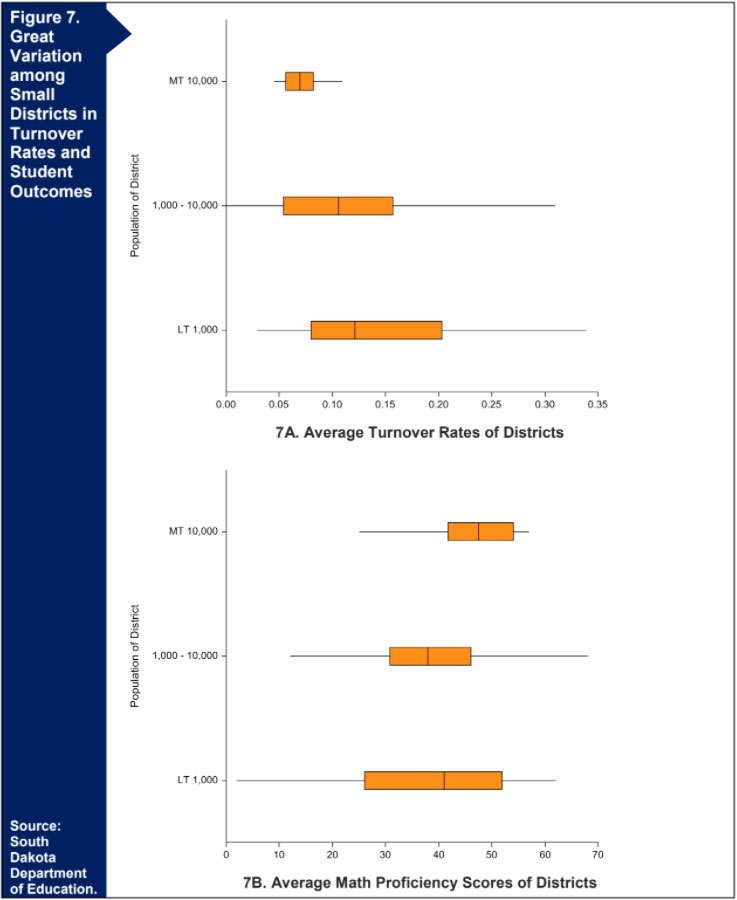
We will examine these district-level variations in greater detail in the phase two, but for now, we can show the fact of variation. For example, Figure 7 shows the average turnover rates for districts of different population size. It is clear that the most variance is found among the smallest districts. (Note that each box plot shows the median value with the line in the middle of the box; the ends of each box show the middle 50 percent of the distribution (ranging from the 25th percentile to the 75th percentile); while the lines (or “whiskers”) reach out to the 10th and 90th percentiles.) The box plots show that while about a quarter of the small districts had turnover rates over 0.20 (or one out of five FTEs) in a year, another quarter of the small districts had turnover rates of less than 0.08 (or about one out of twelve FTEs). Clearly we cannot easily generalize about all small districts, and learning about the reasons for the differences may be enlightening.
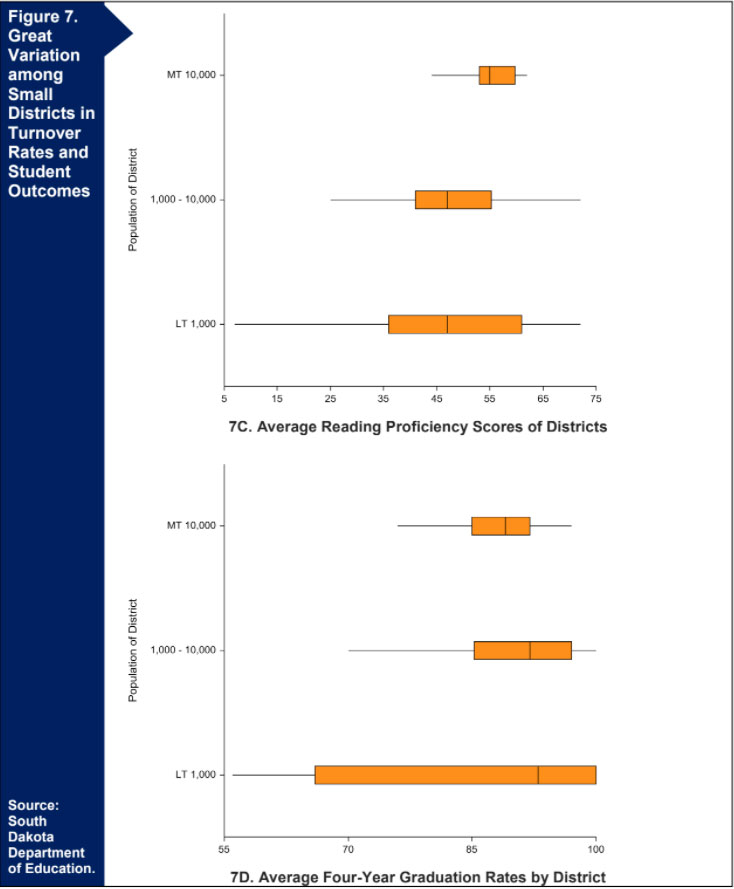
Although we cannot at this point make any causal connections, we do find some correlation between turnover rates and various student outcomes at the district level; we will continue to explore that relationship as we work toward a final report. In the meantime, however, we can say that, just like the case with turnover rates, we also see in Figure 7 that the small districts show large differences on student outcomes. The figures in Figure 7B and 7C, for example, reveal the big differences among the largely rural districts in terms of their average math and reading proficiency scores, based on tests administered in South Dakota, as well as their graduation rates. The four-year graduation rates show even greater variation among the smallest districts. In sum, as that rural districts see greater turnover rates, they also are more likely to have teachers with weaker formal qualifications; their student outcomes are, on average, somewhat below those of larger districts; and these districts also differ a great deal among themselves on all of these measures. These differences offer an opportunity to see how different districts and perhaps their schools are meeting the significant challenges they confront. That, we hope, is one of the tasks for our final report.
The report reveals differences in turnover and, and to a lesser extent, vacancies across public school districts in South Dakota. Although prior analyses, such as the 2015 Blue Ribbon Report, concludes that the state as a whole maintains a good balance between the demand and supply of teachers, then and in the near future, our initial analyses of turnover and vacancies suggests that there may be important variations at the local district level. That is, an overall statewide balance may coincide with shortages in some and perhaps many districts. More finely grained analyses also show differences in teacher attributes, including teachers with advanced degrees and years of experience, across districts. While the report does not draw a direct link from these two teacher attributes to student learning, differences in teacher qualities (along with many other factors) may well be associated with differences in learning. The report also points to potential shortages by specialization, which may differ markedly from the needs at the national level.
In sum, the district-level analyses suggest the value of understanding the evolution of demand for, and supply of, teachers at the local level. Yet, the findings do not fully convey what more detailed analyses of teacher-level data could yield. In other words, teach-level data will help to better understand what may lie behind (and influence) the flows into positions, movements among schools, and exits from teaching in South Dakota’s public schools. Such analyses comprise the next steps to enable detailed and disaggregated forecasts. More than calling attention to potential shortages at the state — and importantly, the local — level, the estimates can help inform decisions on alternative strategies. It should be possible to use the analyses and forecasts to anticipate both increases or decreases in hiring needs (in the simple case, when a district’s elementary school cohorts are relatively large or relatively small) and whether relatively low pools of qualified applicants for posts are likely to be short-term (owing to an uptick, for example, in enrollment in teacher preparation programs). Such information enables consideration of options tailored to the source of the immediate shortage.
Further, even long term options may lie in alternatives other than the preparation and placement of full-time teachers in schools. South Dakota’s Department of Education has pursued such alternatives, for example, through Northern State University’s (NSU) Center for Statewide e-Learning, which uses certified master teachers to deliver instruction via technology to schools lacking sufficient numbers of students in certain subjects and courses to mount a full class, or in subjects nearly impossible for some districts to field a pool of applicants qualified to teach. Similarly, NSU’s Rural School Teaching Placement Project offers a flexible way to bring supervised preservice teacher candidates to schools that may await the pool of newly certified teachers coming out in two or three years.
Further, there may be potential for collaboration among districts, including collaboration with nonpublic systems (including Bureau of Indian Education (BIE) schools, as envisaged for particular purposes under South Dakota’s Indian Education Advisory Council) to bring qualified teachers to difficult-to-fill positions in two or more schools. These approaches support teachers and teaching in schools, by covering short term and persistent vacancies and constraints imposed by scale for some school districts and in some specializations.
The point is that more finely grained forecasts enable a better understanding of the particular shortage problems that need to be addressed, where they occur, and whom they affect, and so invites consideration of a more focused range of alternatives in addressing the shortages in ways that support teachers, teaching, and learning.