January 18, 2021
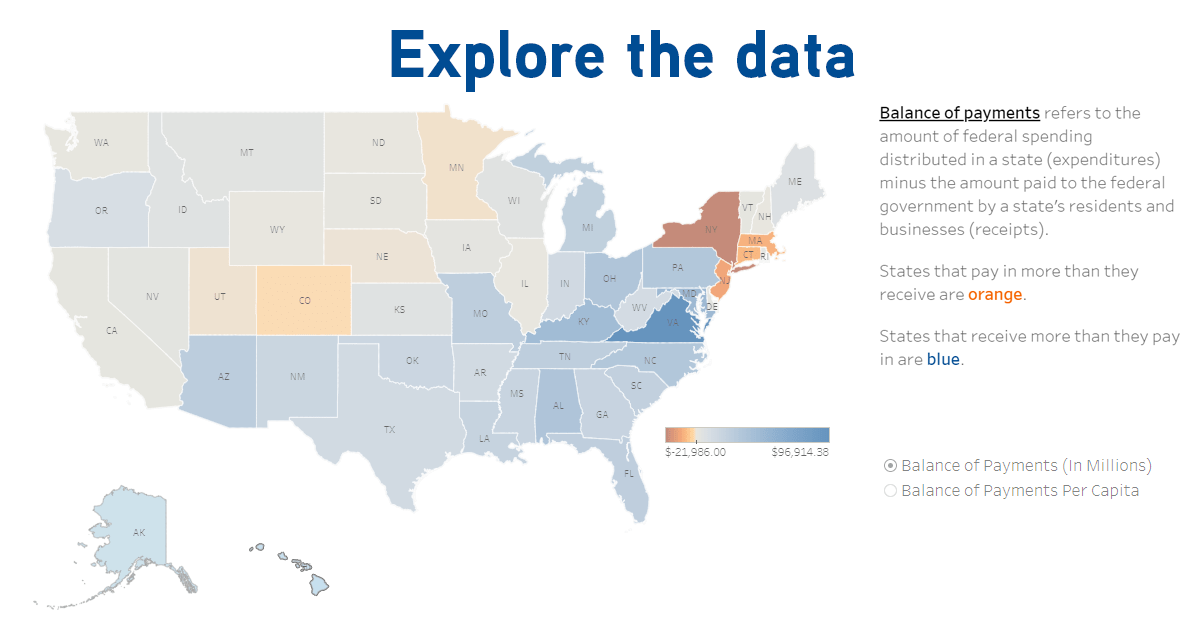
In its fourth annual analysis, the Rockefeller Institute of Government has estimated the distribution of Federal budget receipts and expenditures across the United States. This report examines where Federal funds are generated and spent, the balance of payments differential that exists between the states, the primary explanations for those differences, and how those gaps change over time.
This annual analysis is designed to aid policymakers as they continue to discuss whether there is too much redistribution or too little, and the impact of those redistribution decisions on states. The Rockefeller Institute estimated detailed revenue and spending data for Federal fiscal year (FFY) 2018 and developed a preliminary data series for FFY 2019. This report presents a national analysis while paying close attention to New York.
The findings based on this analysis are clear: New York’s residents and businesses continue to contribute more in taxes than the state receives back in Federal spending. Key findings from this year’s report include:
+ Over five years, New York taxpayers have given $142.6 billion more to the federal government than they have received back in federal spending, the most of any state.
+ Preliminary analysis of 2019 data indicate that at -$22.8 billion, New York maintains its five-year trend as having the least favorable balance of payments of any state in the nation.
+ New York’s shortfall in 2019 is larger than that of second-ranked New Jersey (-$10.3 billion) and third-ranked Massachusetts (-$9.9 billion) combined. California and Connecticut round out the list of the top five states with the least favorable balances.
+ The New York State per capita balance of payments, -$1,172, continues to rank as one of the least favorable in the nation. New York’s negative per capita balance of payments is less than all but Connecticut (-$1,614) and Massachusetts (-$1,439).
+ The Federal per capita balance of payments in 2019 is $2,412—a net positive to citizens of these states. New Yorkers pay $3,584 more than this average.
Last year’s report provided a preliminary analysis of the impact of the Federal Tax Cuts and Jobs Acts of 2017 (TCJA). The TCJA partially shifted revenue collection from corporate income tax to individual income taxes. The share of Federal revenue generated from individual income taxes grew from 50.3 percent in 2017 to 53.0 percent in 2018 and was 51.9 percent in 2019. The preliminary 2018 analysis was based on the most current data sets available at the time: the 2017 Internal Revenue Service’s Statistics of Income series and the final FFY 2018 Federal data from the 2020 Budget of the U.S. Government. While the approach showed the impacts of the shift from corporate to individual income taxes, it did not provide insights into how the TCJA shifted the relative individual income tax burdens among the states.
This year’s analysis revised the preliminary analysis by using the 2018 Statistics of Income series. Between 2017 and 2018, New York’s share of individual income tax burden grew from 8.9 to 9.1 percent. The 0.2 percentage point growth was the second highest after California. This was the primary factor in the downward revision of the 2018 balance of payments estimate from -$22.0 billion to -$26.3 billion.
As the overall distribution of tax burdens and Federal budget spending across the nation changes over time, understanding how these changes impact the states provides critically important information when evaluating the fairness and appropriateness of proposed changes in fiscal policy.