
Over the past couple of years, the public has received a steady diet of news about teachers striking all over the country. From Denver, Colorado to Oakland, California teachers have been going on strike in part because they don’t believe they are being adequately compensated. To counter this trend, in recent weeks at least one presidential candidate has put forward a proposal to boost the salaries of teachers across the country.
The Rockefeller Institute recently released an interactive data portal on teacher salaries across the country, including how much salaries have grown since 2002. Although average teacher salaries have grown across the nation from 2007-17 (see Figure 1), in a number of states these increases haven’t kept pace with the salaries of other occupations.
Figure 1. Change in Ratio of Teacher Salaries to the Salaries of Individuals with Bachelor’s Degrees, 2007-2017
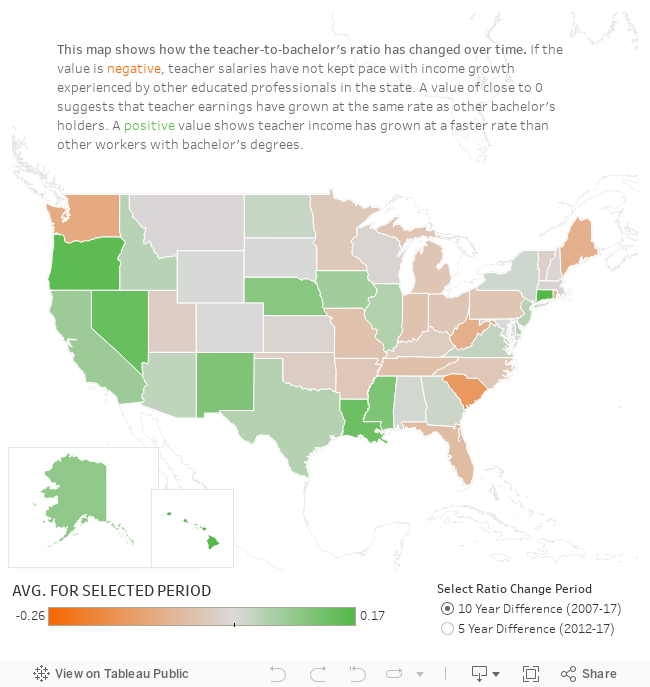
SOURCE: Rockefeller Institute of Government analysis of U.S. Bureau and Labor Statistics, Occupational Employment Statistics data and U.S. Census Bureau, Current Population Survey data.
Teacher Salaries in New York State
On average, New York State teachers make more than teachers in any other state in the nation: $79,588. From 2002-17, the average teacher salary increased $19,729, the fifteenth largest growth increase in the nation.
Below we explore potential variations by region and by wealth category, which is how the state designates a school district: low-need (wealthiest), average-need, and high-need (least wealthy). We compared median salaries in each region and by wealth category. To provide an assessment of teacher salaries relative to other salaries, we compared the median teacher salary to the median regional salary of individuals with bachelor’s degrees and graduate degrees.
Teacher Salaries by Region
Using the Regional Economic Development Council regions, Long Island and Mid-Hudson school districts pay their teachers the most in the state. The median salaries of teachers on Long Island are nearly double the median salaries of teachers in the Finger Lakes — the region with the lowest median salary. Given that the Long Island and the Mid-Hudson Valley regions are higher cost and higher wealth areas, this isn’t a surprise.
TABLE 1. 2017 Median Teacher Salary, by Region
REDC Median Teacher Salary Districts (#) Long Island $111,603 125 Mid-Hudson $99,559 106 Capital Region $65,230 75 Western NY $64,689 81 Central NY $62,428 49 Mohawk Valley $60,981 54 North Country $60,320 64 Southern Tier $56,554 63 Finger Lakes $55,976 70
| REDC | Median Teacher Salary | Districts (#) |
| Long Island | $111,603 | 125 |
| Mid-Hudson | $99,559 | 106 |
| Capital Region | $65,230 | 75 |
| Western NY | $64,689 | 81 |
| Central NY | $62,428 | 49 |
| Mohawk Valley | $60,981 | 54 |
| North Country | $60,320 | 64 |
| Southern Tier | $56,554 | 63 |
| Finger Lakes | $55,976 | 70 |
SOURCE: Rockefeller Institute of Government analysis of New York State Education Department’s Personnel Master File (2017-18) and U.S. Census Bureau, American Community Survey (2017) data. NYSED data does not include New York City School District, so those districts are omitted. The rest of the school districts in the “Big 5” are included.
Comparing similar degree holders from each region, we find that the median teacher salary in each region exceeds the median salary of people with bachelor’s degrees (Table 2). In fact, median teacher salaries range from 16 percent higher (Finger Lakes) to 75 percent higher (Long Island) than individuals with bachelor’s degrees. We also find that not only do teachers in the Long Island and Mid-Hudson regions make more than teachers in other parts of the state, they also make the most compared to those individuals with bachelor’s degrees in their region.
Table 2. Comparison of Median Regional Teacher Salaries to Median Regional Salaries of Individuals with Bachelor’s Degrees
REDC Median Teacher Salary Median Bachelor Salary Bachelor Ratio Districts (#) Long Island $111,603 $63,687 1.75 125 Mid-Hudson $99,559 $62,692 1.59 106 Mohawk Valley $60,981 $42,043 1.45 54 Western NY $64,689 $45,092 1.43 81 North Country $60,320 $42,127 1.43 64 Capital Region $65,230 $50,222 1.30 75 Central NY $62,428 $50,455 1.24 49 Southern Tier $56,554 $45,867 1.23 63 Finger Lakes $55,976 $48,366 1.16 70
| REDC | Median Teacher Salary | Median Bachelor Salary | Bachelor Ratio | Districts (#) |
| Long Island | $111,603 | $63,687 | 1.75 | 125 |
| Mid-Hudson | $99,559 | $62,692 | 1.59 | 106 |
| Mohawk Valley | $60,981 | $42,043 | 1.45 | 54 |
| Western NY | $64,689 | $45,092 | 1.43 | 81 |
| North Country | $60,320 | $42,127 | 1.43 | 64 |
| Capital Region | $65,230 | $50,222 | 1.30 | 75 |
| Central NY | $62,428 | $50,455 | 1.24 | 49 |
| Southern Tier | $56,554 | $45,867 | 1.23 | 63 |
| Finger Lakes | $55,976 | $48,366 | 1.16 | 70 |
SOURCE: Rockefeller Institute of Government analysis of New York State Education Department’s Personnel Master File (2017-18) and U.S. Census Bureau, American Community Survey (2017) data. NYSED data does not include New York City School District, so those districts are omitted. The rest of the school districts in the “Big 5” are included (Buffalo, Rochester, Syracuse, and Yonkers). A ratio of less than one means that teachers are paid less than other bachelor’s degree holders in that region. A ratio of more than one means that teachers are paid more.
Similarly, although there is a wide range of median salaries in different regions, when compared to salaries of individuals with graduate degrees within each region, teachers are comparably or better paid. The median teacher salary in all but three of the regions exceeds the median salary of people with graduate degrees (Table 3). In the Capital Region, for instance, the median teacher salary is the third highest in the state, but when compared to similar occupations in the region, Capital Region teachers make slightly less. That could be, in part, because of the potentially higher salaries of government employees or those working in the burgeoning regional tech industry.
Table 3. Comparison of Median Regional Teacher Salaries to Median Regional Salaries of Individuals with Graduate Degrees
REDC Median Teacher Salary Median Graduate Salary Graduate Ratio Long Island $111,603 $87,586 1.27 Mid-Hudson $99,559 $83,271 1.20 Western NY $64,689 $55,281 1.17 Mohawk Valley $60,981 $57,500 1.06 North Country $60,320 $58,241 1.04 Central NY $62,428 $61,852 1.01 Southern Tier $56,554 $57,590 0.98 Capital Region $65,230 $67,484 0.97 Finger Lakes $55,976 $60,318 0.93
| REDC | Median Teacher Salary | Median Graduate Salary | Graduate Ratio |
| Long Island | $111,603 | $87,586 | 1.27 |
| Mid-Hudson | $99,559 | $83,271 | 1.20 |
| Western NY | $64,689 | $55,281 | 1.17 |
| Mohawk Valley | $60,981 | $57,500 | 1.06 |
| North Country | $60,320 | $58,241 | 1.04 |
| Central NY | $62,428 | $61,852 | 1.01 |
| Southern Tier | $56,554 | $57,590 | 0.98 |
| Capital Region | $65,230 | $67,484 | 0.97 |
| Finger Lakes | $55,976 | $60,318 | 0.93 |
SOURCE: Rockefeller Institute of Government analysis of New York State Education Department’s Personnel Master File (2017-18) and U.S. Census Bureau, American Community Survey (2017) data. NYSED data does not include New York City School District, so those districts are omitted. The rest of the school districts in the “Big 5” are included (Buffalo, Rochester, Syracuse, and Yonkers). A ratio of less than one means that teachers are paid less than other graduate degree holders in that region. A ratio of more than one means that teachers are paid more.
Teacher Salary by District Wealth
When this analysis is broken down by the relative wealth of districts, the most affluent districts have the highest median teacher salaries. At more than $113,000, the median salary for teachers in the state’s wealthiest schools far outpace all other wealth categories (Table 4). However, district wealth doesn’t neatly correspond to a higher teacher salary in every case. High-need urban/suburban districts — or the least wealthy districts — have a higher median salary (more than $71,000) than average-need districts (more than $65,000). Moreover, there is variation among the state’s least affluent districts. Among the state’s least wealthy districts, urban/suburban districts’ salaries are 26 percent higher than in rural districts. Further analysis will be needed to see to what extent other factors including regional costs, pay levels designed to incentivize teachers to work in these districts, or having significantly fewer districts drive the difference in salary levels between rural and urban high-need schools.
Table 4. Median Teacher Salary by Wealth Category
Type Median Teacher Salary Districts (#) Low-Need (wealthiest) $113,164 132 High-Need Urban/Suburban (least wealthy) $71,092 46 Average-Need $65,106 334 High-Need Rural (least wealthy) $56,613 154
| Type | Median Teacher Salary | Districts (#) |
| Low-Need (wealthiest) | $113,164 | 132 |
| High-Need Urban/Suburban (least wealthy) | $71,092 | 46 |
| Average-Need | $65,106 | 334 |
| High-Need Rural (least wealthy) | $56,613 | 154 |
SOURCE: Rockefeller Institute of Government analysis of New York State Education Department’s Personnel Master File (2017-18) data. NYSED data does not include New York City School District, so those districts are omitted. The rest of the school districts in the “Big 5” are included (Buffalo, Rochester, Syracuse, and Yonkers).
When compared to other regional salaries, teachers make more regardless of the overall wealth of the district. As Table 5 illustrates, the median teacher salary is higher than the regional median salary of other bachelor- and graduate-degree holders. For low-need (or wealthier) school districts, median teacher salaries are 76 percent higher than regional median salaries of those with bachelor’s degrees, and 30 percent higher than those with graduate degrees — the highest in each category. The median teacher salaries from other wealth category districts are about the same (Table 5) — 30 to 35 percent higher than individuals with bachelor’s degrees and a modest 1 to 5 percent higher than individuals with graduate degrees.
Table 5. Median Teacher Salary Compared to Salaries Individuals with Bachelor’s and Graduate Degrees
Type Median Teacher Salary Median Bachelor Salary Median Graduate Salary Bachelor Ratio Graduate Ratio Low-Need $113,164 $64,380 $87,039 1.76 1.30 High-Need Urban/Suburban $71,092 $52,475 $68,732 1.35 1.03 Average-Need $65,106 $50,220 $62,081 1.30 1.05 High-Need Rural $56,613 $43,175 $55,850 1.31 1.01
| Type | Median Teacher Salary | Median Bachelor Salary | Median Graduate Salary | Bachelor Ratio | Graduate Ratio |
| Low-Need | $113,164 | $64,380 | $87,039 | 1.76 | 1.30 |
| High-Need Urban/Suburban | $71,092 | $52,475 | $68,732 | 1.35 | 1.03 |
| Average-Need | $65,106 | $50,220 | $62,081 | 1.30 | 1.05 |
| High-Need Rural | $56,613 | $43,175 | $55,850 | 1.31 | 1.01 |
SOURCE: Rockefeller Institute of Government analysis of New York State Education Department’s Personnel Master File (2017-18) and U.S. Census Bureau, American Community Survey (2017) data. NYSED data does not include New York City School District, so those districts are omitted. The rest of the school districts in the “Big 5” are included (Buffalo, Rochester, Syracuse, and Yonkers). A ratio of less than one means that teachers are paid less than other graduate degree holders in that region. A ratio of more than one means that teachers are paid more.
When examining individual districts by highest and lowest salaries, there isn’t a consistent pattern by wealth category. That is, the districts with the highest salaries aren’t the state’s most affluent districts and the lowest salaries aren’t always found in the least wealthy districts. As Table 6 shows, compared to other salaries in the region, the highest paid teachers come from districts of varying levels of wealth. Likewise, the districts with the lowest median teacher salaries across the state are a mix of high-need districts and average-need districts (though none of the state’s wealthiest districts are in the bottom 10 lowest salaries).
Table 6. Highest Median and Lowest-Median Teacher Salaries Compared to Others
REDC DISTRICT Wealth Category Median Teacher Salary Graduate Salary Bachelor's Salary Ratio (Grad) Ratio (Bach) Highest salaries compared to other regional salaries > Long Island JERICHO UFSD Low-Need $145,957 $87,039 $68,628 1.68 2.13 Western NY NIAGARA FALLS CITY SD High-Need Urban/Suburban $93,128 $58,337 $51,019 1.60 1.83 Mid-Hudson ONTEORA CSD Average-Need $102,336 $64,303 $50,077 1.59 2.04 Mid-Hudson CARMEL CSD Average-Need $132,210 $85,234 $60,934 1.55 2.17 Long Island COLD SPRING HARBOR CSD Low-Need $134,672 $87,586 $63,687 1.54 2.11 Long Island SYOSSET CSD Low-Need $133,814 $87,039 $68,628 1.54 1.95 Western NY WEST SENECA CSD Average-Need $92,008 $61,741 $50,220 1.49 1.83 Mid-Hudson SCARSDALE UFSD Low-Need $142,689 $95,944 $70,044 1.49 2.04 Mid-Hudson MARLBORO CSD Average-Need $95,302 $64,303 $50,077 1.48 1.90 Lowest salaries compared to other regional salaries > Capital Region EDINBURG COMMON SD Average-Need $51,000 $73,475 $62,283 0.69 0.82 Capital Region GREEN ISLAND UFSD Average-Need $48,132 $68,732 $52,245 0.70 0.92 Capital Region GLENS FALLS COMN SD High-Need Urban/Suburban $44,586 $62,081 $46,824 0.72 0.95 Capital Region LANSINGBURGH CSD High-Need Urban/Suburban $51,236 $70,203 $52,705 0.73 0.97 Mid-Hudson KIRYAS JOEL VILLAGE UFSD High-Need Urban/Suburban $57,261 $78,086 $61,004 0.73 0.94 Capital Region STILLWATER CSD Average-Need $55,125 $73,475 $62,283 0.75 0.89 Central NY STOCKBRIDGE VALLEY CSD High-Need Rural $46,564 $61,852 $46,885 0.75 0.99 Finger Lakes MT MORRIS CSD High-Need Rural $46,353 $60,318 $50,282 0.77 0.92 Finger Lakes KENDALL CSD Average-Need $47,506 $60,843 $46,450 0.78 1.02 North Country HARRISVILLE CSD Average-Need $46,101 $58,241 $47,688 0.79 0.97
| REDC | DISTRICT | Wealth Category | Median Teacher Salary | Graduate Salary | Bachelor's Salary | Ratio (Grad) | Ratio (Bach) |
| Highest salaries compared to other regional salaries > | |||||||
| Long Island | JERICHO UFSD | Low-Need | $145,957 | $87,039 | $68,628 | 1.68 | 2.13 |
| Western NY | NIAGARA FALLS CITY SD | High-Need Urban/Suburban | $93,128 | $58,337 | $51,019 | 1.60 | 1.83 |
| Mid-Hudson | ONTEORA CSD | Average-Need | $102,336 | $64,303 | $50,077 | 1.59 | 2.04 |
| Mid-Hudson | CARMEL CSD | Average-Need | $132,210 | $85,234 | $60,934 | 1.55 | 2.17 |
| Long Island | COLD SPRING HARBOR CSD | Low-Need | $134,672 | $87,586 | $63,687 | 1.54 | 2.11 |
| Long Island | SYOSSET CSD | Low-Need | $133,814 | $87,039 | $68,628 | 1.54 | 1.95 |
| Western NY | WEST SENECA CSD | Average-Need | $92,008 | $61,741 | $50,220 | 1.49 | 1.83 |
| Mid-Hudson | SCARSDALE UFSD | Low-Need | $142,689 | $95,944 | $70,044 | 1.49 | 2.04 |
| Mid-Hudson | MARLBORO CSD | Average-Need | $95,302 | $64,303 | $50,077 | 1.48 | 1.90 |
| Lowest salaries compared to other regional salaries > | |||||||
| Capital Region | EDINBURG COMMON SD | Average-Need | $51,000 | $73,475 | $62,283 | 0.69 | 0.82 |
| Capital Region | GREEN ISLAND UFSD | Average-Need | $48,132 | $68,732 | $52,245 | 0.70 | 0.92 |
| Capital Region | GLENS FALLS COMN SD | High-Need Urban/Suburban | $44,586 | $62,081 | $46,824 | 0.72 | 0.95 |
| Capital Region | LANSINGBURGH CSD | High-Need Urban/Suburban | $51,236 | $70,203 | $52,705 | 0.73 | 0.97 |
| Mid-Hudson | KIRYAS JOEL VILLAGE UFSD | High-Need Urban/Suburban | $57,261 | $78,086 | $61,004 | 0.73 | 0.94 |
| Capital Region | STILLWATER CSD | Average-Need | $55,125 | $73,475 | $62,283 | 0.75 | 0.89 |
| Central NY | STOCKBRIDGE VALLEY CSD | High-Need Rural | $46,564 | $61,852 | $46,885 | 0.75 | 0.99 |
| Finger Lakes | MT MORRIS CSD | High-Need Rural | $46,353 | $60,318 | $50,282 | 0.77 | 0.92 |
| Finger Lakes | KENDALL CSD | Average-Need | $47,506 | $60,843 | $46,450 | 0.78 | 1.02 |
| North Country | HARRISVILLE CSD | Average-Need | $46,101 | $58,241 | $47,688 | 0.79 | 0.97 |
SOURCE: Rockefeller Institute of Government analysis of New York Stated Education Department’s Personnel Master File (2017-18) and U.S. Census Bureau, American Community Survey (2017) data. NYSED data does not include New York City School District, so those districts are omitted. The rest of the school districts in the “Big 5” are included (Buffalo, Rochester, Syracuse, and Yonkers). Also omitted are districts with fewer than eight teachers, where there is a lack of reliable data. Bronxville School District in Westchester County pays their median teacher an annual salary of $362,000, well over $100,000 more than any other districts, so we have omitted that district as an outlier. A ratio of less than one means that teachers are paid less than other graduate degree holders in that region. A ratio of more than one means that teachers are paid more.
As the analysis above shows, while there are significant differences in how teachers are compensated between regions in New York, the median salary paid to teachers is consistently higher compared to other workers with bachelor’s and graduate degrees.
As the national debate over teacher salaries continues, we will explore other issues and further analyze additional data about how teachers are compensated, including how salaries relate to potential teacher shortages and student performance, and how states with teacher salaries that lag behind similar occupations affect the teacher market.
ABOUT THE AUTHORS
Jim Malatras is president of the Rockefeller Institute of Government
Nicholas Simons is project coordinator at the Rockefeller Institute of Government