September 2017
State and local government tax revenues showed relatively strong growth in the first quarter of 2017, compared to the recent past. However, the growth should be viewed with caution as the strong quarter is partially attributable to income tax growth in California and New York, as well as to the shifting of bonus payouts out of 2016 to 2017. The quick changes in revenue growth underline increased volatility and uncertainty in revenue streams. Overall, state governments have been hit harder by slowing tax revenue growth than local governments. Some state and local governments — particularly those that rely heavily on sales taxes or income taxes, as some large cities do — and local governments in oil-producing states are likely to be faring much worse than average.
The recent volatility in state tax revenue has been caused by:
States have been forecasting weak revenue growth for fiscal years 2017 and 2018. Several states had already reduced their revenue forecasts for fiscal 2017 in the postelection period. We anticipate actual tax revenue collections for fiscal 2017 were short of the forecasts in the typical state. We will release a special report once states have data available on actual revenue collections for fiscal 2017 that ended in June in forty-six states. As for fiscal 2018, revenue forecasts are subject to uncertainty due to factors related to federal tax policy changes, the extent and timing of Federal Reserve interest rate increases, and nonwage income tax recovery, among others. The uncertainty tied to federal policy changes put state forecasters in a tough position and quite understandably makes it harder to forecast state revenues with any precision.
States will need to worry about at least three kinds of effects from federal tax reform, all of which are highly uncertain at this point: (1) the impact of tax reform on the economy; (2) the direct impact of tax reform on state government tax bases in cases where states conform to federal tax law; and (3) indirect impacts on state tax revenue as taxpayers change their behavior in anticipation of, and in response to, federal tax reform. While the federal tax reform bill has not been enacted yet, we believe that taxpayers have already taken actions and shifted part of their taxable capital gains from 2016 to 2017. The large declines in estimated and final payments is a clear indication that some wealthy taxpayers had decelerated income.
As a candidate, President Trump proposed significant cuts in top income tax rates; elimination of the Affordable Care Act’s 3.8 percent net investment income tax imposed on higher-income taxpayers; substantial increases in the standard deduction; and elimination of the federal deduction for state and local taxes, among other things. The likelihood of lower tax rates in 2017 created a large incentive for high-income taxpayers to push income from wages, interest, and other sources out of 2016 into 2017, and to accelerate deductions into 2016, depressing taxable income in 2016. And the proposed increase in the standard deduction created a modest incentive for middle-income taxpayers to accelerate itemized deductions into 2016, when these deductions will be most useful.
If these were the only effects, state taxable income clearly would be depressed in 2016, and pushed up in 2017, although the magnitude would be devilishly hard to predict. We would expect to see lower payments of estimated income tax in December and January and lower payments of final returns in April and May, relative to what otherwise would occur. While these effects are likely, they could be camouflaged in part by another effect: Very high-income taxpayers had an incentive to accelerate payments of state and local government taxes into 2016, to the extent that these taxes are deductible on federal income tax returns, so that they could be used against 2016’s higher tax rates. Thus, these taxpayers would prefer to have paid state income taxes in December rather than in January or in April when returns are filed, and they also might have preferred to pay local property taxes in 2016.
Thus, taxpayers had incentives to reduce taxable income in 2016, but to increase payments of state and local government taxes in 2016 despite lower income. It will be very difficult for state revenue forecasters to sort this out. As we have discussed in past State Revenue Reports, behavioral incentives can have powerful effects on state tax revenue even if federal tax reform is not enacted or is substantially different than expected. The possibility of reform is enough to change behavior and some taxpayers will continue gaming nonwage income.
State and local government tax revenues have been growing at an extremely slow pace in the post-Great Recession era, but showed a substantially stronger growth in the first quarter of 2017. For the most part, state governments have been hit harder by slowing tax revenue growth than localities. Some local governments — particularly those that rely heavily on sales taxes or income taxes, as some large cities do — and local governments in oil-producing states are likely to be faring much worse than average. More so, some local governments are being hit hard by the closures of big department stores such as Macy’s or JCPenney, as well as by closures of other stores and shopping malls, which have an adversarial impact on local nonresidential property taxes as well as on sales, personal income, and corporate income taxes.
In the first quarter of 2017, the growth in state and local government revenue from major taxes was 4.2 percent, which is substantially stronger than the 1.9 percent average growth for the four previous quarters (see Table 1). The stronger growth in the first quarter of 2017 is attributable to stronger state personal income tax revenue collections and stronger local government property tax revenue collections. The stronger growth in state personal income and local property tax revenues is not an indication of positive outlook. We shed more light by discussing longer-term trends below.

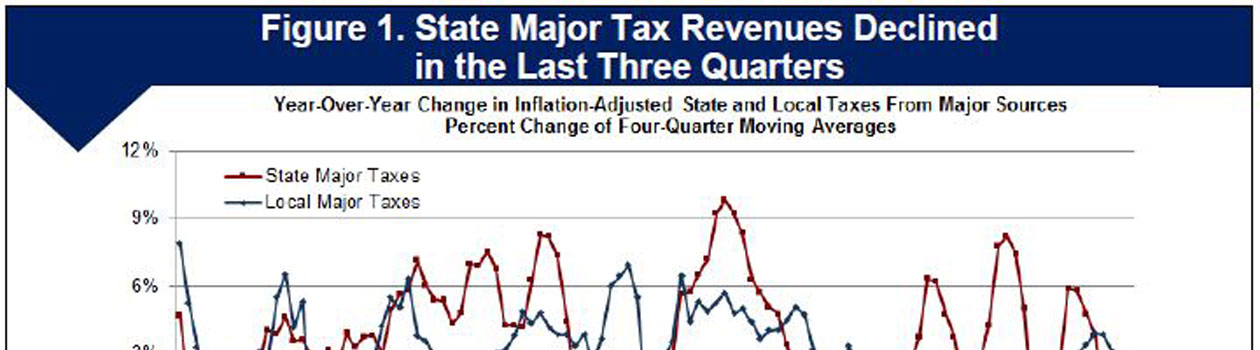
Figure 1 shows changes in major state and local tax revenues over time, specifically, the year-over-year percentage change in the four-quarter moving average of inflation-adjusted state tax and local tax collections from major sources: personal income, corporate income, sales, and property taxes. As shown in Figure 1, state taxes from major sources fluctuated greatly over the last four years, mostly driven by the impact of the federal fiscal cliff and volatility in the stock market. State major taxes, adjusted for inflation, declined 0.8 percent in the last four quarters relative to the year-earlier period, which is the third consecutive quarterly decline. The four quarter moving average of inflation-adjusted local taxes grew 2.1 percent in the first quarter of 2017. Most local governments rely heavily on property taxes, which are relatively stable and respond to property value declines slowly. By contrast, the income, sales, and corporate taxes that states rely heavily on respond rapidly to economic declines. Over the last two decades, property taxes have consistently made up at least two-thirds of total local tax collections.

Figure 2 shows changes in tax revenues over time and highlights the decline in personal income tax revenues. Specifically, looking at the year-over-year percent change in the four-quarter moving average of inflation-adjusted state and local income, sales, and property taxes illustrates how both the income tax and the sales tax showed slower growth, and then outright decline, from 2006 through most of 2009. By this measure, which reflects the prior three quarters as well as the current quarter, state-local personal income and sales tax had weakened substantially in the last four quarters. In fact, state-local income tax collections declined by 0.2 percent, while sales tax collections grew by a modest 0.2 percent in the first quarter of 2017. The four-quarter moving average of inflation-adjusted state-local property taxes grew by 3.1 percent.
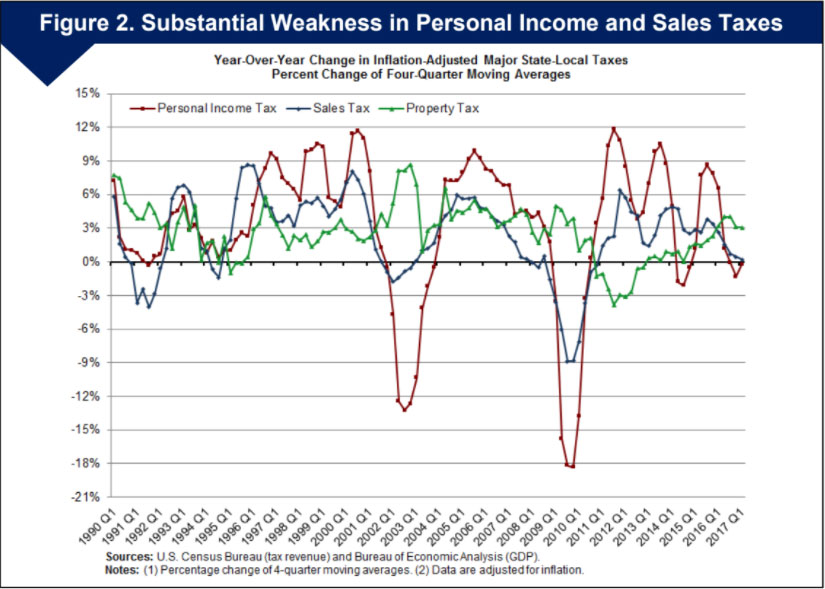
Figure 3 shows that while housing prices have continued to grow, property taxes lag behind, looking at the year-over-year percent change in the four-quarter moving average of the housing price index and local property taxes. Declines in housing prices usually lead to declines in property taxes, with some lag. The deep declines in housing prices caused by the Great Recession led to a significant slowdown in property tax growth and then to an actual decline in fiscal years 2011 and 2012.1 The housing price index began moving downward around mid-2005, with steeply negative movement from the last quarter of 2005 through the second quarter of 2009. The decline in local property taxes lagged behind the decline in housing prices. The trend in the housing price index and local property taxes has been generally upward in the past four years. The housing price index grew 5.7 percent while local property taxes grew 4.6 percent in nominal terms in the first quarter of 2017, compared to the same period in 2016.

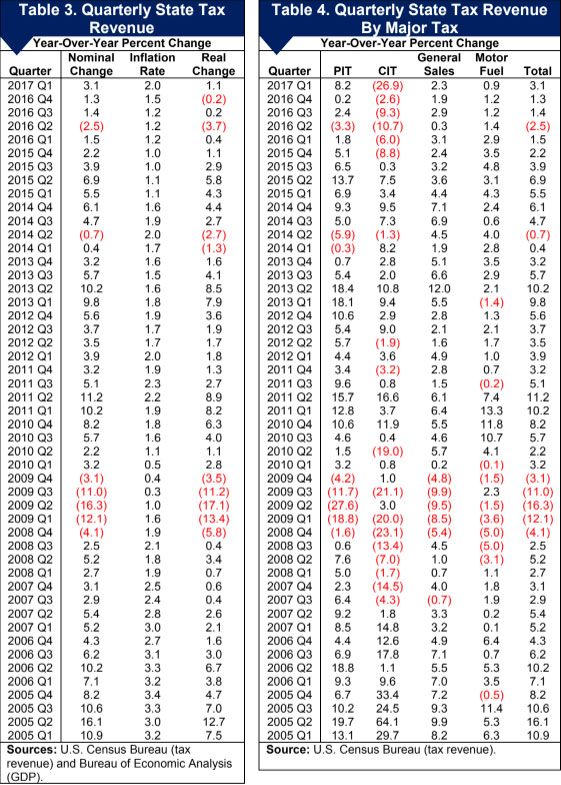
Total state government tax revenue grew 3.1 percent in the first quarter of 2017 relative to a year ago, in nominal terms, according to Census Bureau data as adjusted by the Rockefeller Institute.2 All major tax revenue sources grew, except the corporate income tax, which declined 26.9 percent. Individual income tax collections grew 8.2 percent, while sales tax and motor fuel tax collections grew 2.3 and 0.9 percent, respectively. Table 3 shows growth in state tax revenue with and without adjustment for inflation and Table 4 shows growth by major tax in nominal terms.
Although most oil-producing states were hardest hit by slowing revenue growth in fiscal year 2017, a few other states had declines as well. In the first quarter of 2017, twelve states had declines in total state tax collections (see Figure 4). Preliminary data for the second quarter of 2017 indicate that at least another fourteen states faced declines in overall tax revenue collections. These declines left some state budgets with some holes to fix. The result was a record number of eleven states having late budgets for fiscal year 2018. State tax revenue growth is likely to remain slow and highly uncertain throughout the fiscal year 2018.
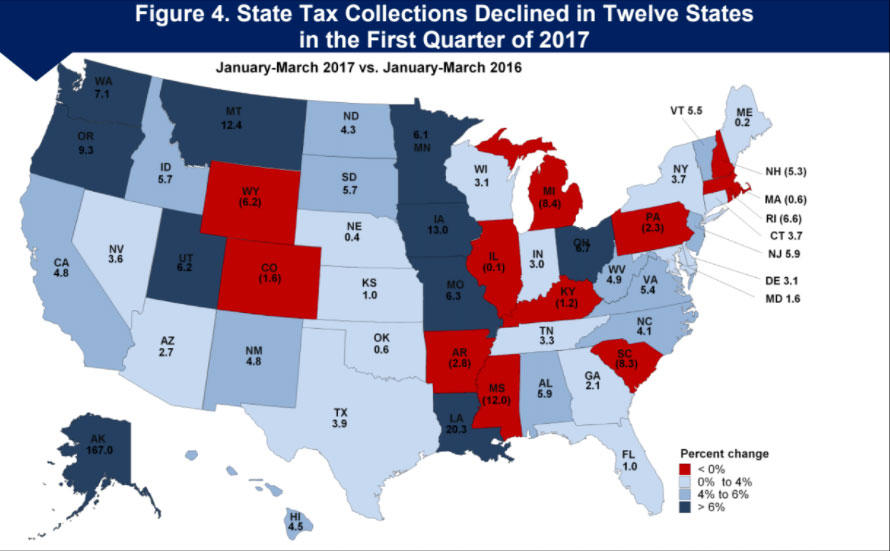
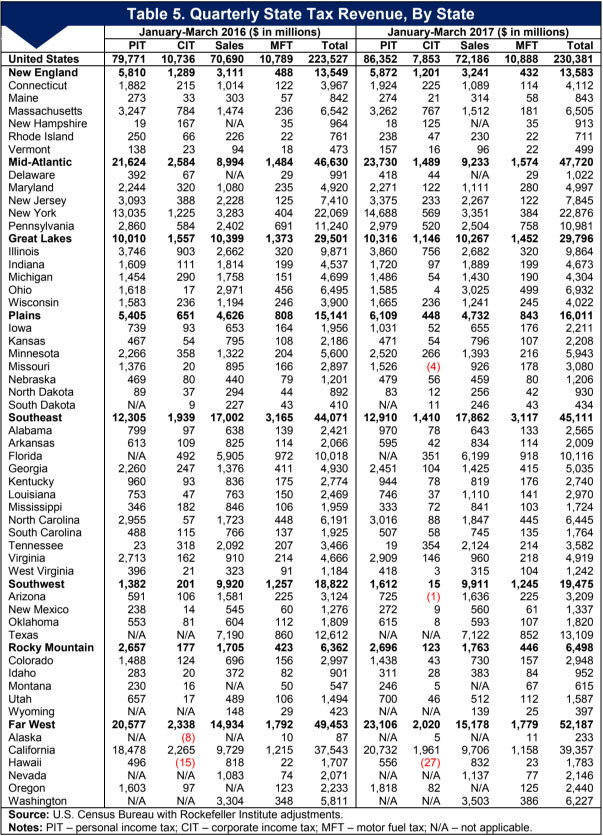
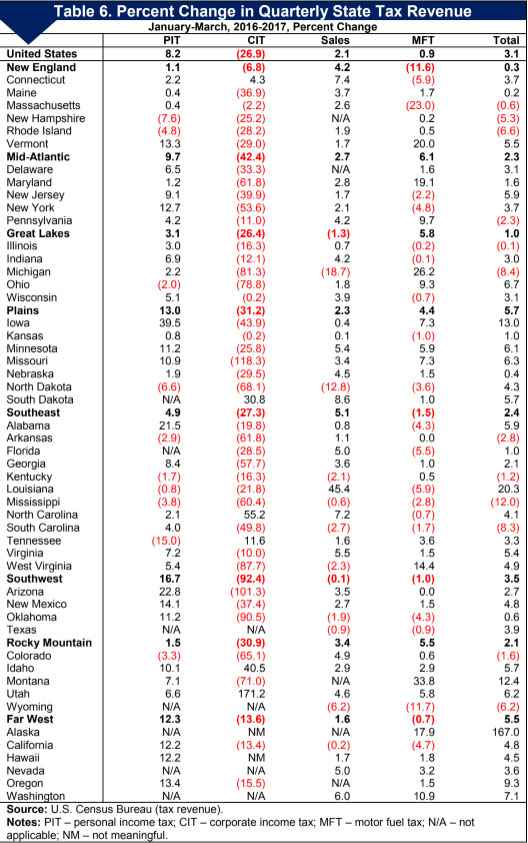
Total state tax revenues showed growth across all regions in the first quarter of 2017 (see Table 5 and Table 6). The Plains region had the strongest growth at 5.7 percent, followed by the Far West region at 5.5 percent. The New England region had the weakest growth at 0.3 percent. Among individual states, Mississippi and Michigan had the largest declines in total tax revenue collections at 12.0 and 8.4 percent, respectively. The oil- and mineral-dependent states generally rely heavily on severance taxes.
The steep oil price declines throughout 2015 and early 2016 led to declines in severance tax collections and depressed economic activity, leading to weakness or declines in other taxes. However, some of the oil- and mineral-dependent states reported growth in the first quarter of 2017, which is misleading as it reflects an increase from the extremely depressed revenue levels of the previous two years. For example, total state tax revenues had the largest growth in Alaska and Louisiana in the first quarter of 2017, at 167.0 and 20.3 percent, respectively. In Alaska, severance taxes constitute the preponderance of Alaska’s total tax revenue and remain less than half as large as they were three and four years ago. The growth in Louisiana is mostly attributable to sweeping legislative changes, including 1-percent increase in sales tax and an increase in the tax on tobacco and alcohol.
Personal income tax revenues grew 8.2 percent in nominal terms and 6.2 percent in inflation-adjusted terms in the first quarter of 2017 compared to the same period in 2016. State personal income tax revenues were weak throughout calendar year 2016 and the recent strength should be viewed with caution as it is largely attributable to strong personal income tax revenue growth in two states: California and New York. If we exclude both California and New York, personal income tax collections for the rest of the nation grew 5.5 percent. Moreover, it appears that there has been some shifting of bonus payouts out of 2016 to 2017, in anticipation of lower personal income tax rates at the federal level. Personal income tax collections grew across all regions. The Southwest region had the largest growth at 16.7 percent, while the New England region had the weakest growth at 1.1 percent.
Ten states reported declines in personal income tax collections. The largest declines among broad-based income tax states was in North Dakota at 6.6 percent, which is partially attributable to cuts in income tax rates, but also due to declines in employment in recent months caused by the weakness in oil production.
We can get a clearer picture of collections from the personal income tax by breaking this source down into four major components: withholding, quarterly estimated payments, final payments, and refunds. The Census Bureau does not collect data on individual components of personal income tax collections. The data presented here were collected by the Rockefeller Institute from the states directly (Table 2). Our data are more current than the Census Bureau data and provide a preliminary view of income tax collections for the second quarter of 2017, which was strong despite continued weakness in estimated and final payments.
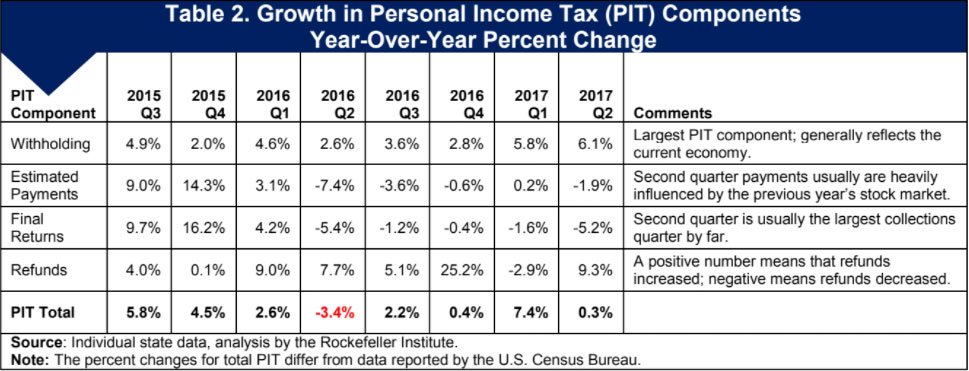
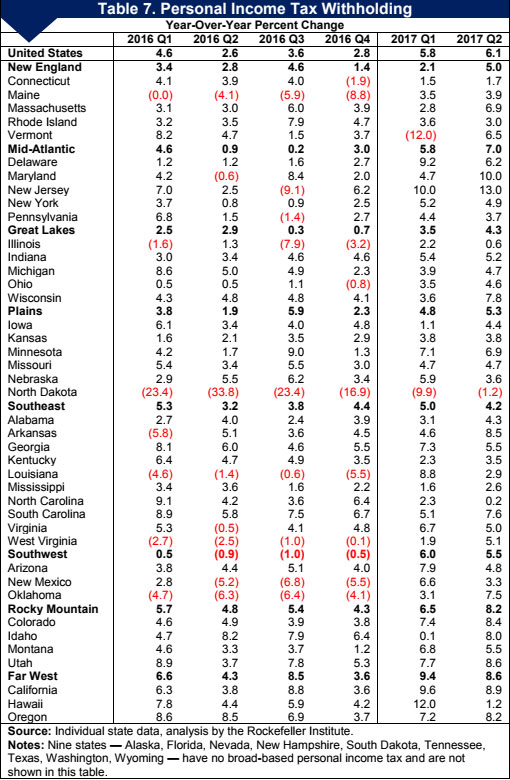
Withholding is a good indicator of the current strength of personal income tax revenue because it comes largely from current wages and is much less volatile than estimated payments or final settlements. Table 7 shows state-by-state, year-over-year quarterly growth in withholding for the last six quarters. Growth in withholding was 4.6 percent in the first quarter of 2016 but softened substantially in the second, third, and fourth quarters, at 2.6, 3.6, and 2.8 percent, respectively. According to preliminary data, withholding resumed stronger growth in the first and second quarters of calendar year 2017 at 5.8 and 6.1 percent, respectively.
All states but North Dakota reported growth in withholding for the second quarter of 2017, with twenty states reporting growth of over 5 percent. North Dakota has seen declines in withholding for nine consecutive quarters, which is driven by tax rate reductions and the negative impact of the oil crash on the state economy and employment. Withholding grew in all regions. The Far West region had the strongest growth at 8.6 percent, while the Southeast had the weakest growth at 4.2 percent.
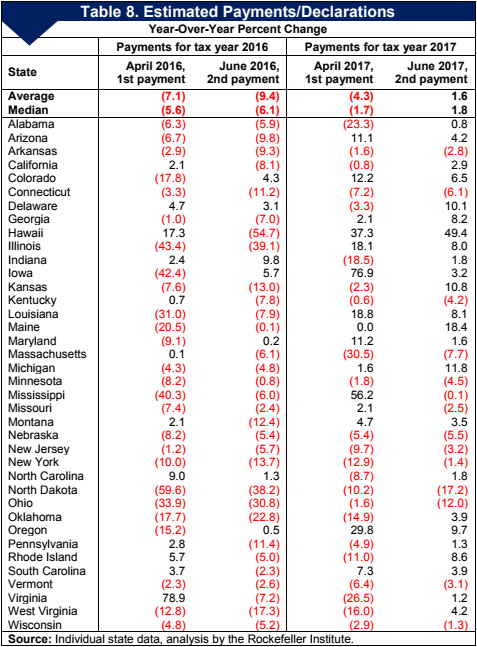
The highest-income taxpayers generally make estimated tax payments (also known as declarations) on their income not subject to withholding tax. This income often comes from investments, such as capital gains realized in the stock market. Estimated payments normally represent a small proportion of overall income-tax revenues, but can have a large impact on the direction of overall collections. Estimated payments accounted for roughly 22 and 26 percent, respectively, of total personal income tax revenues in the first and second quarters of 2017.
The first payment for each tax year is due in April in most states and the second, third, and fourth payments are generally due in June, September, and January (although many high-income taxpayers make this last state income tax payment in December, so that it is deductible on the federal tax return for that year, rather than the next). In some states, the first estimated payment includes payments with extension requests for income tax returns on the prior year, and thus is related partly to income in that prior year. Subsequent payments generally are related to income for the current year, although often that relationship is quite loose.
The first payment is usually difficult to interpret as it can include a mix of payments related to the current tax year and the previous tax year. It can reflect, for example, stock market activity in the previous year. The second and third payments are easier to interpret because they are almost unambiguously related to the current year. Weakness in these payments can reflect weakness in nonwage income, such as that generated by the stock market. However, it can also be “noisy” in the sense that it reflects taxpayers’ responses to tax payment rules as well as to expected nonwage income.
In the thirty-eight states for which we have data for the first and second payments (mostly attributable to the 2017 tax year), the median payment declined 1.7 percent for the first payment but grew 1.8 percent for the second payment compared to the previous year, which is a substantial improvement compared to the median declines of 5.6 and 6.1 percent observed in the first and second payments of tax year 2016, respectively (see Table 8).
Average growth for the second payment was 1.6 percent for the thirty-eight states for which we have complete data. Most of the growth is attributable to a single state (California), which had the largest growth in estimated payments in terms of dollar value. Without California, average estimated payments for the rest of the states grew 0.5 percent. The growth for the second payment is also partially attributable to a stronger stock market. Still, fourteen states had declines in estimated payments for the second payment, with two states reporting double-digit declines.
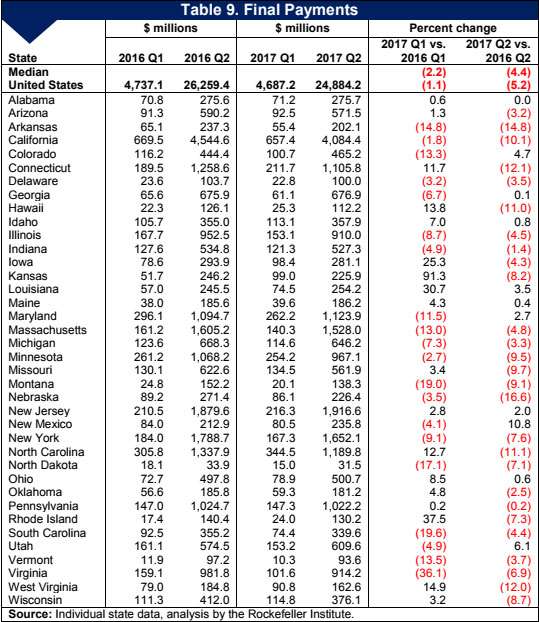
Final payments normally represent a smaller share of total personal income tax revenues in the first, third, and fourth quarters of the tax year, and a much larger share in the second quarter of the tax year, due to the April 15th income tax return deadline. Final payments accounted roughly for 23 percent of all personal income tax revenues in the second quarter of 2017.
Final payments with personal income tax returns declined 2.2 percent in the median state in the first quarter of 2017, and by 4.4 percent in the second quarter of 2017. Table 9 shows nominal amounts and year-over-year quarterly growth in final payments for the first and second quarters of 2016 and 2017.
Personal income tax refunds declined by 2.9 percent in the first quarter of 2017 but grew by 9.3 percent in the second quarter of 2017 compared to the same quarters in 2016. In total, states paid out about $2.0 billion more in refunds in the second quarter of 2017. Overall, twenty-three states paid out more refunds in the secon quarter of 2017 compared to the same quarter of 2016. New York and California alone paid out $1.1 billion and $0.6 billion more refunds in the second quarter of 2017. The large refunds in New York are attributable to timing issues, and New York paid out $1.4 billion less in the first quarter of 2017 compared to the same period in 2016.
Estimated payments of income tax are particularly difficult to interpret now. The stock market declined in the first half of calendar year 2016 but resumed strong growth in the second half of 2016. The calendar year average growth for the stock market was 2.6 percent in 2016 and the year-end to year-end growth was 9.5 percent, as measured by the S&P 500 index.5 All else equal, this would suggest relatively strong capital gains in 2016, which in turn could boost estimated payments of income tax. However, the picture is muddied by three factors.
First, estimated payments on 2015 income were strong, but perhaps stronger than underlying tax liability required, resulting in weak final returns the following April, as discussed in past State Revenue Reports. Taxpayers may have had the ability to reduce their estimated payments in 2016 to make them more compatible with underlying liability and with safe harbors allowed in the tax law.
Second, as discussed in the Summary, late in 2016 taxpayers may have expected income tax cuts in 2017 under President Trump. Candidate Trump’s proposed toprate cuts that would have affected some forms of income upon which taxpayers make estimated payments, such as interest and dividends, and his proposed elimination of the ACA net investment income tax would have affected capital gains. And, of course, investors might have expected further cuts for investment income as a result of congressional negotiations. These potential changes created incentives for taxpayers to push income out of 2016 into late 2017 or even 2018, when rates might be lower. Capital gains are the easiest form of income to defer — it is easier to delay selling stocks than it is, say, to postpone working and receiving wages (if one needs the money), and it is easier than convincing a corporation to defer paying dividends, although some of that could occur with closely held corporations. Other kinds of income could be affected, too. For example, retirees could choose to delay withdrawals from IRA and 401(k) accounts. But capital gains deferrals are likely to be the largest sort of deferral because deferring them is easy and because they are taken largely by very high-income taxpayers for whom tax-rate reductions provide the greatest bang for the buck.
How big could the deferral be? We estimate, based on our analysis of the last time major changes in federal tax rates on capital gains were anticipated, that taxpayers might defer as much as 10 to 20 percent of capital gains from 2016 to 2017 or later, although this is an educated guess (backed by data analysis). This seems reasonably consistent with the latest analysis from the Congressional Budget Office, which reports a 10.4 percent decline in capital gains in 2016, despite the relatively strong stock market, at least in the second half of 2016, followed by a strong bounce-back in 2017.6 Whether states were expecting such a decline and bounce-back will vary from state to state. For example, both the Legislative Analyst’s Office and the Department of Finance in California estimated above 15 percent growth in capital gain realizations in 2017.
Officials in New York estimated capital gains realizations to have declined 19.4 percent in calendar year 2016. New York projected a moderate rebound in realizations of 12.5 percent in tax year 2017. 8 Other states also may have greatly varying views. The third factor that could influence the income tax in the short term is that despite the incentive to push income out of 2016 and into 2017, taxpayers also had an incentive to pull state and local government tax payments from 2017 into 2016. That is, if they expected lower federal tax rates in 2017, and if they are able to benefit from deducting state and local tax payments (which can depend upon the alternative minimum tax), then it could have been to their advantage to accelerate deductible tax payments into 2017. For example, they may have accelerated payments from January into December, or even decided that they should pay even more estimated income taxes in December, and pay less when tax returns are filed in April. This could help to explain why estimated payments, although weak during 2016, did not drop off significantly at the end of the year.
All of this makes for a very confusing situation for states, with little data that can be used to decide upon appropriate assumptions. Preliminary data indicate that there was a large downward pressure on April tax returns. That is consistent with the idea that taxpayers deferred nonwage income out of 2016 into 2017 and beyond. President Trump has been pushing for substantial reductions in federal tax rates and — if lower tax rates are expected to be enacted and scheduled to take effect on or after January 1, 2018 — then states may end up with another round of income shifting, which would put further pressure on state income and overall tax revenues for fiscal year 2018.
State sales tax collections in the January-March quarter grew 2.3 percent from the same period in 2016. Inflation-adjusted growth was 0.3 percent. Sales tax collections have seen continuous growth since the first quarter of 2010, with an average quarterly growth of 4.1 percent in nominal terms. The growth, however, was substantially weaker throughout calendar year 2016, at an average quarterly growth of 2.1 percent. Sales tax collections grew in all regions but the Great Lakes and Southwest, where collections declined 1.3 and 0.1 percent, respectively, compared to the same quarter in 2016. The Southeast region had the largest growth at 5.1 percent, while the Far West region had the weakest growth at 1.6 percent.
Among individual states, thirty-five states reported growth in sales tax collections in the first quarter of 2017, while ten states reported declines. Five of those ten states reporting declines are oil- and mineral-dependent states, which continue facing fiscal challenges caused by the dramatic declines in oil prices in late 2015 and early 2016. Overall, the average growth rate in sales tax collections is low by historical standards. Many consumers are more cautious in their discretionary spending in the post-Great Recession period and have had little wage growth to support spending growth.
The weakness in sales tax collections is at least partially attributable to tax dollars owed, but not collected, for online sales and also due to closures of many department and other apparel stores throughout the country, particularly in the Rust Belt states. More and more consumers are shopping online, whether to avoid the extra tax or simply because of the convenience. Addressing the online sales tax loophole has been an ongoing debate in the states and some states have adopted measures such as nexus or “Amazon” laws to address the issue. In addition, states often have negotiated agreements with online retailers to encourage collection of tax. In calendar year 2017, fourteen states have joined other states that already collect taxes on sales by online retail giant Amazon.com LLC or its subsidiaries, and currently all forty-five states with broad-based sales tax collections impose a general sales tax.
(Amazon may or may not collect tax for sales on the Amazon site by non- Amazon vendors, depending on specific instructions provided by the vendors.) The states that made agreements to collect sales taxes on items sold by Amazon would likely see some boost in sales tax collections in the coming quarters. Agreements and laws that require this will certainly help to narrow the online sales tax loophole. However, state efforts alone have had limited effectiveness and Amazon is not the only online retailer. Therefore, it may not be possible to fully stem online revenue losses without congressional action.
Figure 5 shows weak sales-tax growth and modest recovery for energy goods. Figure 5 displays year-over-year percent change in nominal personal consumption expenditures for durable goods, nondurable goods, and services — factors related to sales tax revenues. Figure 5 also shows the year-over-year percent change in nominal sales tax revenue collections. In addition, we show year-over-year percent change in the consumption of energy goods and services.
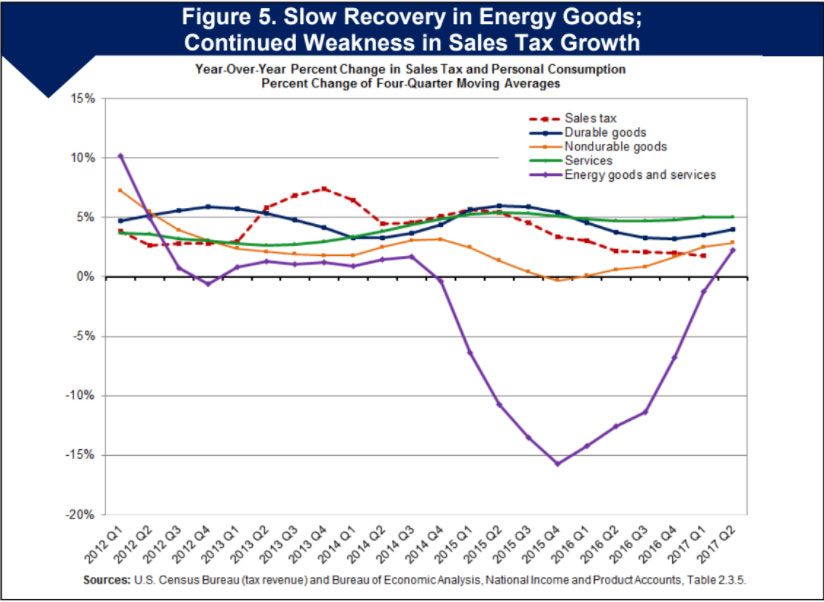
Growth in the consumption of durable goods, an important element of state sales tax bases, has been relatively volatile in the most recent quarters, trending downward throughout 2015 and 2016 and upward in the first half of 2017. Nondurable consumption spending declined in the fourth quarter of 2015 but has resumed growth since then. The decline in nondurable goods is attributable to the declines in gasoline and other energy goods consumption, which was driven downward due to steep declines in oil and gas prices. As shown in Figure 5, consumption of energy goods and services declined dramatically since the last quarter of 2014 and throughout the first quarter of 2017, which led to weakness in sales tax revenue collections throughout 2015 and 2016. Gasoline and other energy goods consumption rebounded in the second quarter of 2017, after ten consecutive quarters of decline. We expect to see further rebounding, driven by the Trump administration’s general support for more pipelines and less regulatory burdens on the oil industry. President Trump’s withdrawal from the Paris climate accord is broadly supported by the oil industry and would likely lead to some growth in the oil industry.
Corporate income tax revenue is highly variable because of volatility in corporate profits and in the timing of tax payments. Many states collect little revenue from corporate taxes and can experience large fluctuations in percentage terms with little budgetary impact. There is often significant variation in states’ gains or losses for this tax.
Corporate income tax revenue declined by a sweeping 26.9 percent in the first quarter of 2017 compared to a year earlier, marking the sixth consecutive quarterly decline. However, the steep decline in corporate income tax revenues in the first quarter of 2017 is largely attributable to timing issue. As mentioned in the Summary section, the Internal Revenue Service changed the income tax return filing due date for returns and final payments from March 15th to April 15th for C-corporations, which is partially the cause of large declines in corporate income tax returns in the first quarter of 2017. Preliminary data for the second quarter of 2017 suggest corporate income taxes grew substantially, by double digits, mostly attributable to filing due date changes. Fortunately, most states do not rely heavily on corporate income taxes, although any volatility is bad for state fiscal planning purposes.
Motor fuel sales tax collections in the first quarter of 2017 increased by 0.9 percent from the same period in 2016. Motor fuel sales tax collections have fluctuated greatly in the post-Great Recession period. Economic growth, changing gas prices, general increases in the fuel-efficiency of vehicles, and changing driving habits of Americans all affect gasoline consumption and motor fuel taxes. Changes in state motor fuel rates also affect tax collections.
There were large disparities among the states and regions. Motor fuel sales tax collections declined in the New England, Southeast, Southwest, and Far West regions and grew in the rest of the regions. The largest decline was in the New England region at 11.6 percent, while the largest growth was in the Mid-Atlantic region at 6.1 percent in the first quarter of 2017 compared to the same quarter in 2016. Nineteen states reported declines in motor fuel sales tax collections in the first quarter of 2017.
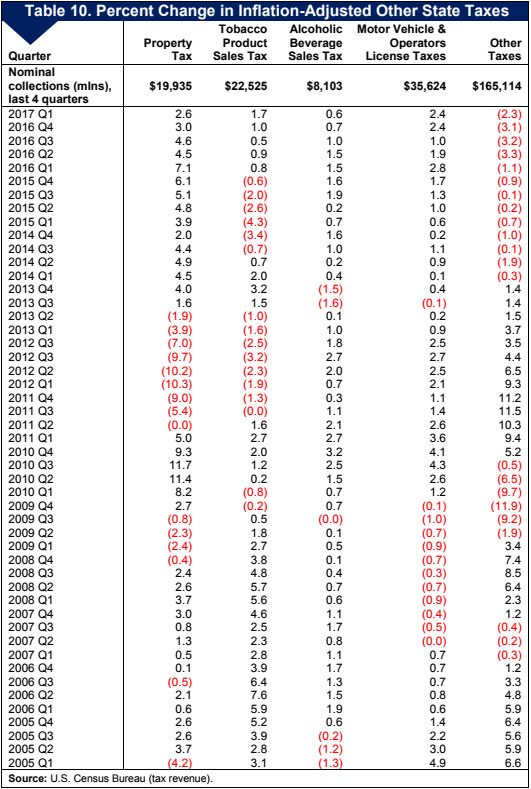
Census Bureau quarterly data on state tax collections provide detailed information for some of the smaller taxes. In Table 10, we show growth rates for smaller taxes, by collecting year-over-year growth rates of the four-quarter average of inflation-adjusted revenue for the nation as a whole. In the first quarter of 2017, states collected $52.9 billion from smaller tax sources, which comprised 23 percent of total state tax collections.
Revenues from smaller tax sources showed a mixed picture in the first quarter of 2017. Inflation-adjusted state property taxes, a small revenue source for states, increased by 2.6 percent. After six consecutive quarterly declines, collections from tobacco product sales finally resumed growth in 2016, mostly due to tax rate increases in several states. In the first quarter of 2017, tobacco product sales revenues grew by 1.7 percent. Tax revenues from alcoholic beverage sales and from motor vehicle and operators’ licenses showed growth at 0.6 and 2.4 percent, respectively, in the first quarter of 2017. Revenues from all other smaller tax sources declined 2.3 percent, marking the thirteenth consecutive quarter of decline.
State revenue changes result from three kinds of underlying forces: state-level changes in the economy (which often differ from national trends), the different ways in which economic changes affect each state’s tax system, and legislated tax changes. The next two sections discuss the economy and recent legislated changes.
Most state tax revenue sources are heavily influenced by the economy. The income tax rises when income goes up, the sales tax generates more revenue when consumers increase their purchases of taxable items, and so on. When the economy booms, tax revenue tends to rise rapidly, and when it declines, tax revenue tends to decline. Figure 6 shows year-over-year growth for two-quarter moving averages in real state tax revenue and in real gross domestic product (GDP), to smooth short-term fluctuations and illustrate the interplay between the economy and state revenues. Tax revenue is usually related to economic growth. As shown in Figure 6, real state tax revenue declined for two consecutive quarters in early 2014, and resumed growth afterwards. Growth in real state tax revenues was downward since the second quarter of 2015 and showed declines in the second and third quarters of 2016. Real state tax revenues resumed growth in the final quarter of calendar year 2016 and grew at 0.5 percent in the first quarter of 2017. Real GDP showed uninterrupted growth since 2010 and grew 1.9 percent in the first quarter of 2017. Overall, growth was also downward for the real GDP between mid-2015 to mid-2016.
Yet, volatility in tax revenue is not fully explained by changes in real GDP, a broad measure of the economy. In 2009 and 2010, state revenue declines were often much larger than the quarterly reductions in real GDP. Throughout 2011, state tax revenue has risen significantly while the overall economy has been growing at a relatively slow pace. In the most recent years, state tax revenues have become even more volatile compared to the general economy. Overall, the growth has been downward both for real GDP and real state tax revenue since the second quarter of 2015, but there was a spike in the last quarter of 2016. Early data indicate further growth in real GDP at 2.1 percent in the second quarter of 2017.
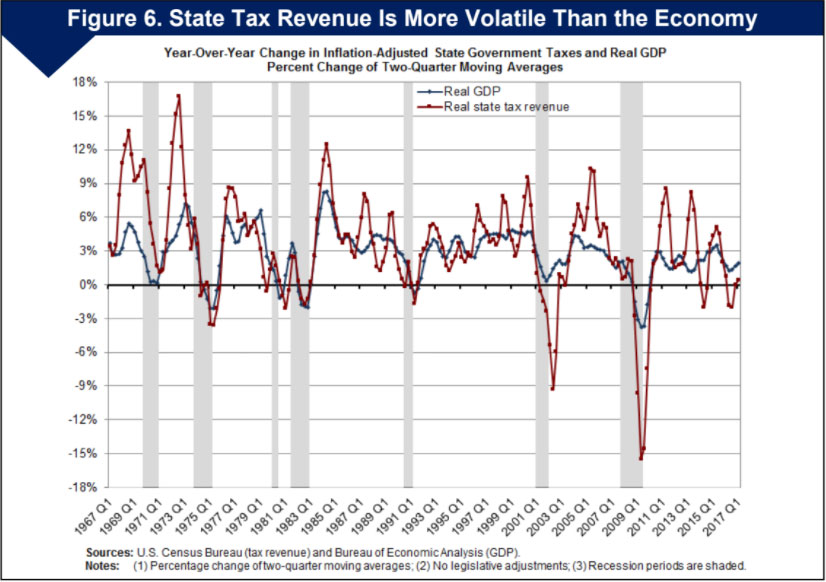
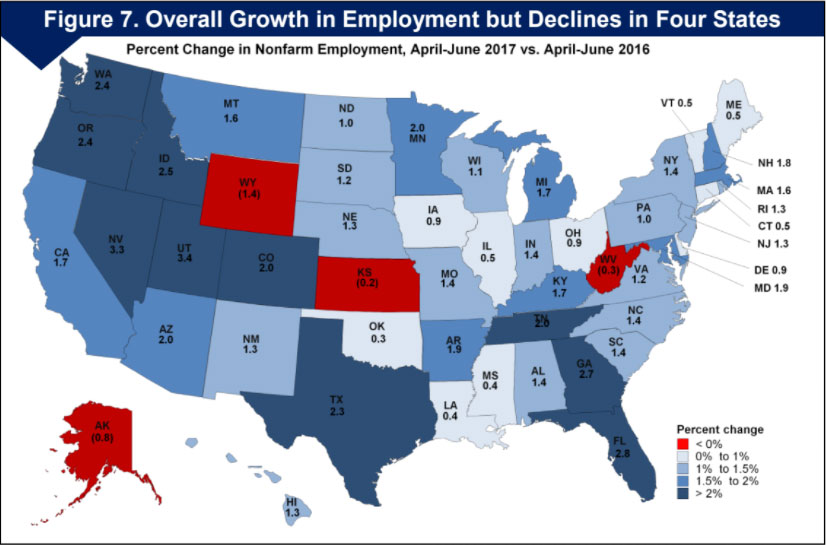
Figure 7 shows year-over-year employment growth in the second quarter of 2017 compared to the same quarter in 2016. For the nation as a whole, employment grew 1.6 percent in the second quarter of 2017. On a year-over-year basis, employment grew in forty-six states. Four states — Alaska, Kansas, West Virginia, and Wyoming — reported declines. The employment declines in these states are partially attributable to the large drop in oil prices as they are all highly reliant on the oil industry, with the exception of Kansas. Wyoming had the largest declines at 1.4 percent, followed by Alaska at 0.8 percent.
Another important element affecting trends in tax revenue growth is changes in states’ tax laws. During the January-March 2017 quarter, enacted tax increases and decreases produced an estimated gain of $229 million compared to the same period in 2016. 10 Tax changes decreased personal income tax by approximately $635 million, increased sales tax by $477 million, and decreased corporate income taxes by$170 million. Enacted tax changes also increased motor fuel taxes by $223 million, cigarette taxes by $218 million, and some other taxes by $110 million. Below, we discuss some of the major enacted tax changes and their expected impact on tax revenues for fiscal 2017.
Fifteen states enacted personal income tax decreases, and two enacted tax increases. The largest decrease was in Ohio due to a phase-in of an across-the-board income tax reduction of 6.3 percent. Ohio also expanded its earned income tax credit and personal exemptions, and increased the small business tax deduction for filers reporting business income under the personal income tax. These changes are estimated to result in a $1.1 billion reduction in income tax collections in fiscal year 2017.
In North Carolina, legislators increased the standard deduction for the 2016 tax year, and the flat income tax rate will fall from 5.75 percent to 5.499 percent in the 2017 tax year under previously enacted legislation. These changes are estimated to result in a $0.5 billion reduction in fiscal year 2017. Massachusetts and Maine also enacted income tax changes that would reduce income tax collections by $226 million and $175 million, respectively, in fiscal year 2017.
Eleven states enacted sales tax decreases and eight states enacted increases. The most noticeable sales tax changes are in Louisiana, where legislators increased the sales tax rate by 1 percentage point and eliminated several exemptions. These changes are estimated to increase sales tax revenues by $1.2 billion. Other noticeable sales tax changes are in Connecticut, Maine, North Carolina, Pennsylvania, and South Dakota, where projected increases range between $102 million and $276 million. Pennsylvania expanded the sales and use tax to include digital downloads. South Dakota increased the sales and use tax rate by 0.5 percent. Connecticut, Maine, and North Carolina adopted various legislated sales tax changes. Twelve states enacted corporate income tax decreases and three states enacted increases. The largest corporate income tax changes are in California and North Carolina, with projected decreases of $280 and $270 million, respectively. In California, the governor signed a restructured Managed Care Organization tax package, which is estimated to reduce corporate income taxes. In North Carolina, state officials cut the corporate income tax rate.
Four states — Louisiana, Ohio, Pennsylvania, and West Virginia — enacted cigarette tax increases. The largest legislated cigarette tax hikes are in Pennsylvania and Ohio, where enacted tax changes are projected to increase cigarette tax collections by $496 million and $170 million, respectively, in fiscal year 2017. Seven states enacted motor fuel tax increases, while Ohio enacted decreases. The most noticeable legislated changes were in Michigan and Washington, with an expected net increase of $317 million and $170 million, respectively.
Other major tax changes include reinstatement of the auto rental excise tax and an increase in premium insurance tax to health maintenance organizations in Louisiana, with a projected net increase of $258 million in fiscal year 2017. Officials in Michigan increased the vehicle registration tax by 20 percent with a projected net increase of $148 million in fiscal 2017. Officials in Pennsylvania enacted several measures, including increasing the bank share tax rates and the tax rate on casino table games, with the projected net tax revenue gain of $114 million in fiscal 2017.
Overall, more states enacted significant tax changes for fiscal years 2016 and 2017 than for the previous two fiscal years. The net enacted tax changes increase tax revenues in fiscal years 2016 and 2017, while the net enacted tax changes reduced revenue for fiscal years 2014 and 2015.
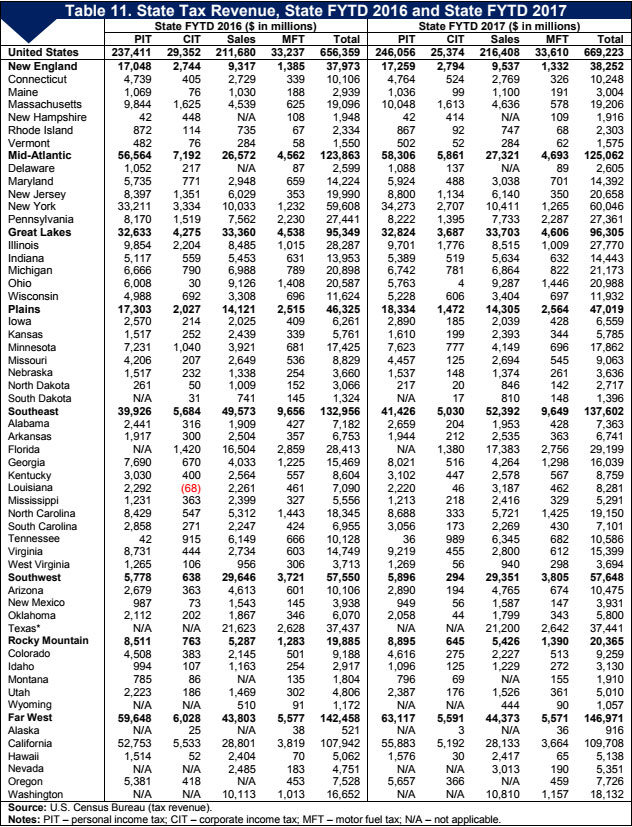
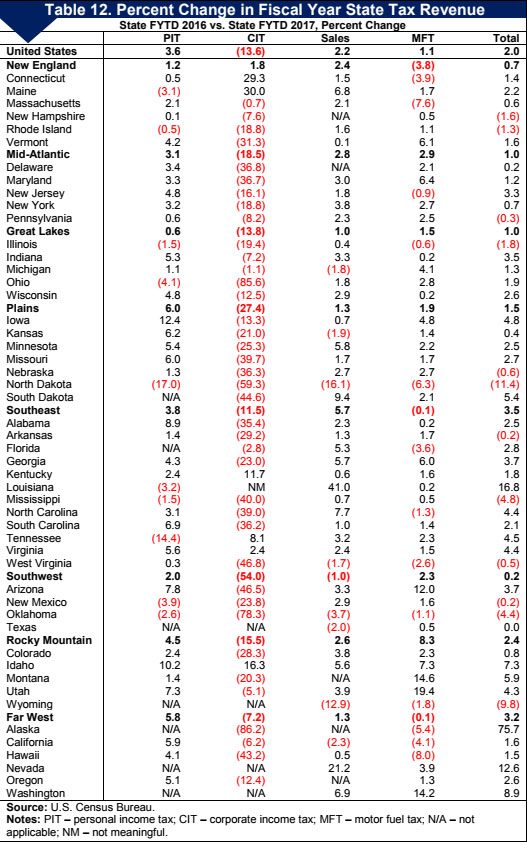
Through the first three quarters of fiscal 2017, states collected $669.2 billion in total tax revenues, a gain of 2.0 percent from $656.4 billion in the same period of fiscal 2016, according to Census data (see Table 11 and Table 12). The personal income tax and sales tax both showed growth at 3.6 and 2.2 percent, respectively, in the first three quarters of fiscal 2017 compared to the same period of 2016, while corporate income tax decreased by 13.6 percent.
All regions had growth in overall tax collections in the first three quarters of fiscal 2017. The Southeast region had the strongest growth increase at 3.5 percent, while the Southwest region had the softest growth at 0.2 percent. Thirty-eight states reported growth in the first three quarters of fiscal 2017, while twelve states reported declines. The greatest declines were reported in North Dakota and Wyoming at 11.4 and 9.8 percent, respectively. Thirty-seven of forty-five states with broad-based sales tax collections reported growth in sales tax collections. Thirty-three states reported growth in personal income tax collections, while ten states reported declines.
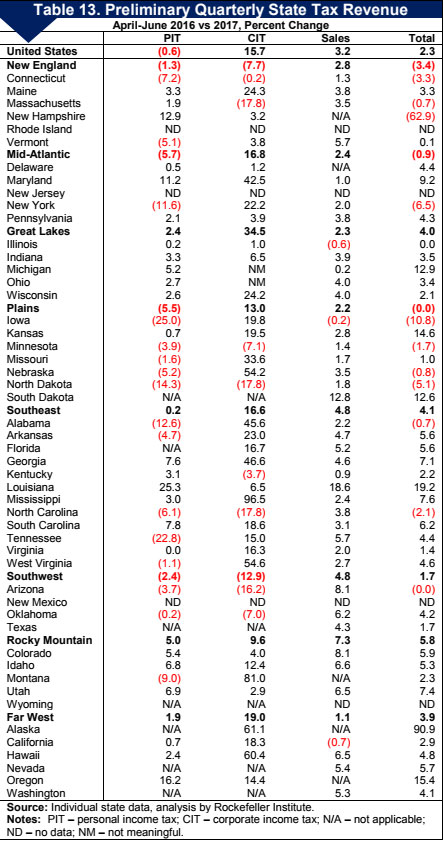
Preliminary data collected by the Rockefeller Institute for the April-June quarter of 2017 show continued growth in sales tax and overall state tax revenue collections, but declines in personal income tax revenue collections. Total tax collections increased by 2.3 percent in the second quarter of 2017 compared to the same quarter in 2016, while sales tax collections grew 3.2 percent. Personal income tax collections declined 0.6 percent and corporate income tax collections grew 15.7 percent.
Table 13 shows state-by-state changes in major tax revenues for the second quarter of 2017 compared to the same quarter of 2016. According to preliminary data, eleven states had declines in overall state tax revenue collections, with New Hampshire having the largest declines. Sixteen states reported declines in personal income tax collections and eight states reported declines in sales tax collections in the second quarter of 2017. We will provide a complete analysis of tax revenue collections for the second quarter of 2017 after the Census Bureau’s data for the quarter are available and after the Rockefeller Institute has had a chance to review and revise the Census data as necessary for any data corrections.
States continue to forecast weak tax revenue growth for fiscal year 2018. The median forecasts of income tax and sales tax growth are 4.2 percent and 3.7 percent, respectively. For more complete analysis and data on state-by-state revenue forecasts for fiscal years 2017 and 2018, see our By The Numbers report “Weak Revenue Forecasts, Large Uncertainties Ahead”.11 We will release a special report on revenue forecasts once we have actual fiscal year 2017 revenue collections and revised forecasts for all states for fiscal 2018.
State government tax revenue growth was weak throughout fiscal year 2017, reflecting the sharp declines in oil prices, general slow growth in the economy, and volatile income tax revenues.
Depressed oil prices continue to be a significant drag on the oil- and mineral- dependent states. According to preliminary data, states highly dependent on oil and mineral tax revenue had significant declines in overall state tax revenue collections. In addition, the oil- and mineral-dependent states have seen declines or weakening in employment. These states will continue facing fiscal challenges in the absence of significant policy changes.
State budgets face a major fiscal uncertainty under the Trump administration: the likelihood of significant federal tax reform. Anticipating new legislation, many taxpayers changed their behavior in late 2016 in ways that could have profound and hard-to-interpret impacts on state tax revenue. Weakness in April income tax returns no doubt reflects these effects, but also could reflect a weaker economy than economic data otherwise might suggest. Tax reform, if enacted, will have further impacts on state tax revenue. Until then, some taxpayers will continue deferring nonwage income. States will need to stay alert in the coming months and do their best to estimate the impact of potential and actual federal tax reform on state budgets.