
April 2016
Gambling has become very popular as a way for states to raise revenue. Many states have been authorizing and expanding additional forms of gambling and finding ways to raise revenues from those activities. States are particularly likely to expand gambling in the aftermath of recessions and subsequent economic downturns in the hopes of raising more revenues.
In the short-run, states indeed do raise additional revenues due to expansion of gambling activities and facilities. However, history shows that in the long-run the growth in state revenues from gambling activities slows or even reverses and declines. In short, the revenue returns deteriorate—and often quickly. This pattern of deterioration may be due to competition with other states for a limited market (saturation), competition between different forms of gambling (substitution), or other factors. Despite the deterioration, the dynamic often continues, as states find new forms of gambling to authorize, open new facilities, and impose higher taxes on gambling. The results are short-run yields and longer-run deterioration.
In addition to the weak long-run growth of gambling revenues, the expansion of highly taxed gambling activities also raises equity issues, since the revenues come largely from low and moderate income households, whose incomes have declined (or not grown) in real terms along with their spending. A related equity issue may be the effects of expansion of state-sanctioned commercial casinos on Native American casinos, which have been around since 1988. These are low-income communities that found a source of income in casinos, but the expansions of state-sanctioned commercial casi- nos may reduce their yields.
Finally, the research literature suggests that expansion of gambling activities has social and economic costs, although the findings are mixed on these points, and it’s unclear whether the economic development impacts are strong enough to counter the costs and other weaknesses of these policies.
State-sanctioned legalized gambling has expanded gradually and continuously over the last four decades. All states except Hawaii and Utah collect revenue from one or more forms of gambling, such as lotteries, commercial casinos, racinos, pari-mutuel wagering, Native American casinos, and some less common types of gambling activities. Currently, forty-four states operate lotteries, nineteen have legalized commercial casino operations, thirteen have racinos, and over forty states allow pari-mutuel wagering. In addition, Native American casinos are legal in twentynine states. Figure 1 shows gambling expansion over time for three major types: lotteries, commercial casinos, and racinos. The dates indicated on Figure 1 are for legalization rather than operations. In general, it takes months or even years of debate before any type of gambling activity is legalized. In addition, it takes months or even years before the legalized gambling activity becomes fully operational.
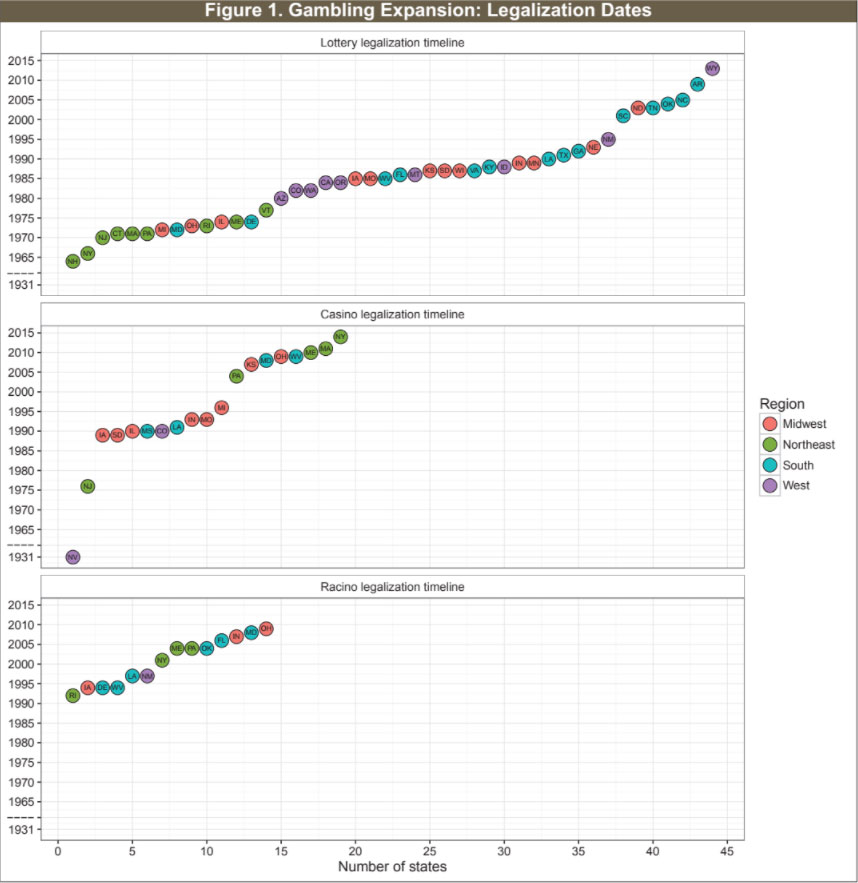
As shown on Figure 1, lottery operations expanded before the 1990s and mostly in response to the 1973 recession and the 1980 double-dip recessions. Casino and racino operations became operational since the 1990s, mostly in response to the last three recessions. In addition, the IGRA of 1988 and legalization of tribal gambling encouraged some state governments to consider the legalization of commercial casinos.
New Hampshire was the first state, in 1964, followed by New York in 1967 to legalize modern-day lottery operations. Overall, the Northeastern states were the early adopters of lottery operations, while the states in the South are the late adopters. By 1990, thirty-two states had legalized lotteries. Another five states legalized lottery operations between 1990 and 2000 and seven more states did so since 2001. Arkansas and Wyoming were the latest states to legalize a lottery in 2008 and 2013, respectively.
Commercial casino and racino gambling are now operating in nearly half of the United States. As of fiscal year 2015, nineteen states had legalized casino operations and fourteen states racino operations. Most of the states with casino and racino operations are located in the Midwest and Northeast regions. Nevada was the first state to legalize casino operations in 1931, followed by New Jersey in 1976. South Dakota and Iowa were the next two states to legalize casinos in 1989. Another nine states legalized casinos between 1990 and 2007. Finally, six more states legalized casino operations since 2008, mostly in response to fiscal stress caused by the Great Recession.
The expansion of lotteries and casinos contributed to declines in revenues from pari-mutuel betting. Therefore, many racetracks were converted into so-called racinos: a hybrid of a casino and a racetrack. In other words, racinos are racetracks that host electronic gaming devices such as slot machines or VLTs. In the most recent years, racinos in some states started operating table games in the hopes of generating more revenues. Rhode Island was the first state to legalize racino operations in 1992, followed by eleven other states between 1994 and 2007. Finally, two more states legalized and opened racinos since 2008.
Overall, casino and racino operations are more common in the Northeastern and Midwestern states and far less common in the Western region. Only three Western states — Colorado, Nevada, and New Mexico — have casino or racino operations. Seven states have operations of both types of facilities: Indiana, Iowa, Louisiana, Maryland, Ohio, Pennsylvania, and West Virginia. Maine legalized racino operations in 2004 and casino operations in 2010 but in 2012 converted its only racino facility into a casino.
Desperate fiscal times often lead to desperate legislative measures, including legalization and expansion of gambling. However, fiscal stress is not the only motivation for gambling adoption.
Many researchers have examined factors leading to the legalization and adoption of gambling activities. The factors that have the strongest impact on gambling legalization are efforts to raise revenue in response to poor state fiscal conditions, efforts to stimulate economic development, an alignment of political interests in support of gambling, and efforts to counteract interstate competition for gambling revenue. States often legalize and expand gambling activities during or after fiscal crises to generate new streams of tax revenues without increasing tax rates on income or sales. When state finances are depressed, legislators turn to gambling to attract tourism and keep gambling residents in-state.
State voters and legislators may also turn to casinos and racinos in the hope of stimulating economic development and revitalizing distressed economies. However, there is no consensus on whether the operation of casinos and racinos leads to economic development.4 Some studies have concluded that casinos and racinos create jobs and improve the regional economies in which they operate.5 Other studies, on the other hand, found that casinos and racinos simply alter the mix of employment and income among industries and do not lead to real economic growth.
Politics and interest group lobbying are also contributing factors to gambling adoption and expansion. Some researchers argued that the interests of the casino industry, state politicians, and legislators are often aligned.7 The gambling industry is a significant contributor to politicians and political parties and plays a crucial role in the political process. However, according to Pierce and Miller, states with a large fundamentalist population are less likely to sanction gambling: “… legalized gambling offers a wonderfully varied set of political forces. From religious fundamentalists on the grassroots level to casino corporations and the horse-racing industry, legalized gambling spurs both mass politics and interest group politics.”
The rapid expansion and geographic proliferation of gambling activities have led to increased interstate competition for the gambling market. State politicians and legislators often legalize gambling activities in response to interstate competition and in the hopes of keeping residents and gambling taxes within the state. Interstate competition is particularly relevant in the case of casino and racino legalization, and particularly for the states that are late adopters. Etzel classified states into four major categories:
According to Etzel, “Many early gambling states were in Category III, and new gambling states aspire to be the same. As legal casinos spread, however, more states will end up in Category IV, and the overall economic impact of casinos is less likely to be positive.”11 In other words, states expand gambling in the hope that they’ll mimic the successes of early adopting states, but the more gambling expands, the more likely it is that economic and revenue gains will be eroded due to competition.
State and local government tax revenues declined significantly during the Great Recession. As a result, many states considered expanding gambling operations to help balance budgets. Since the Great Recession, more than a dozen states have expanded gambling. For example, states introduced new forms of gambling such as video games, sports betting, card rooms, iGaming, and fantasy sports betting. Four states — Maine, Maryland, Ohio, and West Virginia — legalized casino operations. Several states, including Delaware, Maine, Maryland, Pennsylvania, and Rhode Island, legalized poker and other table game operations at their casinos and racinos in the hopes of generating more revenues. New York and nine other states entered into an agreement to create a new multi-state lottery. Online lottery (i.e., sale of lottery tickets over the internet), iGaming, and fantasy sports betting appear to be the next targets for many states. At the end of fiscal year 2015, iGaming was legal only in three states — Delaware, Nevada, and New Jersey. In addition to enacted proposals, gambling expansion proposals failed in a few states. For example, in Hawaii, one of two states with no state-sanctioned gambling, the governor gave serious consideration to a legalized gambling initiative but the measure has not been enacted.
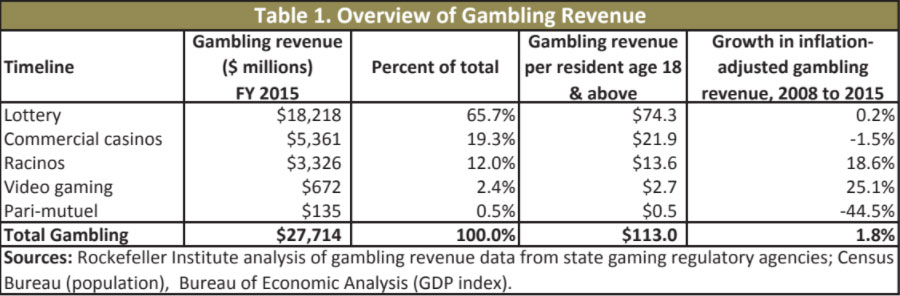
State and local governments raised $27.7 billion in 2015 from major types of gambling. Two-thirds of gambling revenues came from lottery operations. Revenues from casinos and racinos accounted for 19.3 and 12 percent of the total gambling revenues. Revenues from video games and pari-mutuel wagering represented 2.4 and 0.5 percent of the total, respectively (see Table 1).
States also raise revenue from Indian casinos. However, states cannot tax Indian casinos directly, and only raise revenue pursuant to negotiated revenue-sharing agreements. Revenues from Indian casinos are not reported comprehensively, and is considerably less than revenue from commercial casinos. Appendix Table 12 provides available data on state revenue from Indian casinos. This report focuses on commercial casinos and, except where noted otherwise, references to casinos are to commercial casinos.
Gambling revenue plays a relatively small role in state budgets. In most states, gambling revenue represents between 2.0 and 2.5 percent of state own-source general revenues. Only a few states, including Nevada, Rhode Island, and West Virginia, have much higher reliance on gambling revenue. We analyzed three related measures of gambling tax and fee revenue in each state, including the state’s share of the nationwide total, revenue per resident age eighteen and above, and revenue per $1,000 of personal income in the state (see Appendix Table 1). States vary widely in terms of shares of nationwide gambling revenue. New York and Pennsylvania collect the largest shares of such revenue, at 11.5 and 8.8 percent of the national total, respectively.
State revenue from gambling also varies widely when adjusted for population. Nationwide, gambling revenue amounted to $113 per adult resident in 2015.12 In Rhode Island and Nevada, such revenue amounted to over $400 per adult resident. In twenty-four states, gambling revenue was $100 or less per resident aged eighteen or above, and in another fifteen states it was $200 or less. Differences across states reflect differing degrees of gambling tourism, different tax regimes, different preferences for gambling, and other factors. Nationwide, gambling revenue per $1,000 of personal income is $1.8. West Virginia and Nevada report the highest levels of gambling revenue by this measure, at $8.3 and $7.7, respectively.
Gambling revenues in five states — California, Florida, Illinois, New York, and Pennsylvania — have relatively high proportions of the national total, at 5.0 percent or above, but those figures are mostly driven by the states’ comparatively high populations and economic activity. In fact, gambling revenue per resident is below the national averages in California and Florida. On the other hand, four smaller states — Delaware, Rhode Island, South Dakota, and West Virginia — have relatively low shares of the national total but rank well above national averages in gambling revenue per resident and per $1,000 of personal income.
The Rockefeller Institute of Government collected and analyzed revenue data from major types of gambling. In this report, we define gambling revenues as revenues from various taxes and fees transferred to state and local governments. We provide detailed data for the following types of gambling: lotteries, casinos, racinos, and pari-mutuel wagering. In addition, we provide revenue statistics for video gaming for five states that allow video gambling operations and report such data separately. Finally, we also provide some statistics for revenues from Native American casinos for seven of twenty-nine states that have Native American casinos.
States derive the bulk of gambling-related revenues from three major sources — lotteries, casinos, and racinos. Casinos experienced dramatic growth during the 1990s. In the most recent years, much of the growth has shifted to racinos — hybrids of casinos and racetracks — as more states have approved such facilities.14 Pari-mutuel betting, once the major source of gambling revenue for states, now represents less than one percent of overall gambling revenue for the nation. Appendix Table 2 shows state-by-state revenue collections from major gambling revenue sources for fiscal years 2014 and 2015 and Appendix Table 3 shows the percent change in gambling revenues from fiscal year 2014 to 2015.
In fiscal year 2015 states’ revenues from the major types of gambling grew by 1.5 percent compared to fiscal 2014. After adjusting for inflation,15 revenues from major sources of gambling grew by 0.2 percent. Revenues from lottery operations, the most significant source of all gambling revenue, grew by 0.6 percent nationally in fiscal 2015. Revenues from commercial casino operations, the second largest source of all gambling revenue, grew by 1.3 percent. Revenue collections from racino operations and pari-mutuel wagering increased by 4.2 and 2.7 percent, respectively. We also provide revenue data collected from video gaming activities in the following five states: Delaware, Illinois, Louisiana, Montana, and West Virginia. These five states report revenues from video gaming separately, while some other states report revenues from VLTs as part of lottery, racino, or casino operations, as already discussed. The video gaming machines in these five states are not necessarily located at casino or racino locations, but at places such as bars, restaurants, clubs, hotels, etc. For example, West Virginia operates VLTs at racino locations and other video gaming devices (called limited video lottery) in other locations.
Similarly, revenues from video gaming machines in Delaware (called charitable video lottery) are reported separately as they are not necessarily located at the racinos.17 In fiscal 2015, revenues from video gaming grew by 15.4 percent. The rapid growth in video gaming revenues is mostly attributable to Illinois, where video gaming operations were legalized only recently, in July of 2009. The growth in overall gambling revenues is not distributed evenly among the regions. In fiscal year 2015, Mid-Atlantic states had the weakest growth in overall gambling revenues at 0.1 percent, while Far West and New England states had the strongest growth at 2.5 and 2.4 percent, respectively. Of the forty-seven states with gambling revenue, eighteen states reported declines over the year, while twenty-nine states reported growth.
While casinos and racinos are the focus in many states, lotteries remain the primary source of gambling revenue to govern- ments and represent about two-thirds of all gambling revenues. Currently, forty-four states have legalized state lotteries to raise revenues.
Lotteries are regulated or operated by state governments. The gross revenue from lotteries is usually allocated among lottery administration, lottery prizes, and state funds. Most states transfer between 20 to 30 percent of the gross lottery revenues to the state funds. South Dakota and Oregon stand out as having the largest share of gross lottery revenues dedicated to state funds (see Appendix Table 4). Lottery proceeds are often earmarked by law. States normally put revenues generated from the lottery in the general fund or in a dedicated fund targeted toward particular program areas, such as education, veterans’ programs, environmental protection, and natural resources (see Appendix Table 4).
Appendix Table 5 shows state-by-state inflation-adjusted revenue collections from lottery operations for fiscal years 2008-15, percent change in lottery revenues between 2014 and 2015, compound annual growth rates19 between 2008 and 2015, and percent and dollar change in lottery revenues between 2008 and 2015. Wyoming is excluded since the Wyoming Lottery Corporation has not transferred any revenues to the state yet. The Wyoming Lottery Corporation is a quasi-governmental agency and there were no state funds provided to the Lottery Corporation to begin operations; it secured a private loan to begin operations. Once the Lottery Corporation pays off the loan, they will start transferring revenues to the state, most likely in mid-2016.
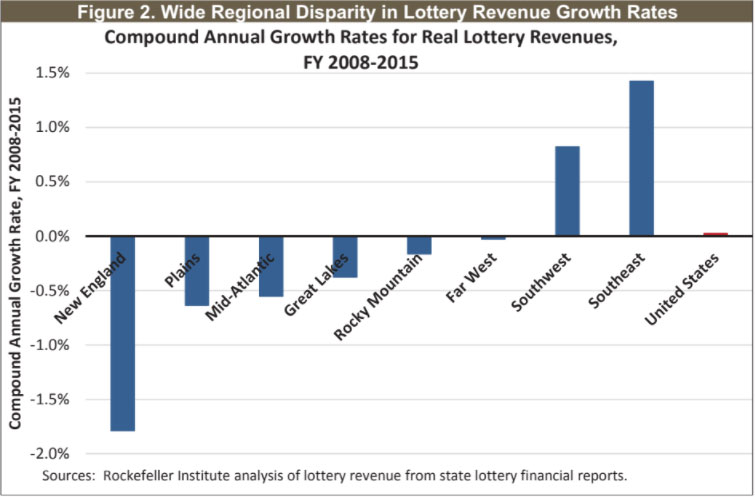
Inflation-adjusted lottery revenue collections declined by $31 million or 0.7 percent from fiscal 2014 to 2015. Twenty-seven states saw declines in real lottery revenues, with four states seeing double-digit declines. Sixteen states reported growth in real lottery revenues, with Louisiana reporting the largest growth at 6.9 percent, followed by Oregon at 6.3 percent. Michigan reported the largest dollar value increase of $43 million or 5.7 percent in fiscal year 2015. Compound annual growth rates varied widely across the states and regions. New England states reported the largest declines while the states in the Southeast region reported the largest growth (see Figure 2). For the nation as a whole, the compound annual growth rate between fiscal 2008 and 2015 was 1.6 percent in nominal terms and less than 0.1 percent in real terms.
Inflation-adjusted compound annual growth rates were negative in twenty-one states. State revenues from lotteries (excluding revenues from VLTs in Delaware, Maryland, New York, Ohio, Rhode Island, and West Virginia) grew by $1.9 billion or 11.4 percent between fiscal 2008 and 2015 in nominal terms. However, after adjusting for inflation, revenues from lotteries increased by 0.2 percent or $36.1 million for the same period.
Commercial casinos and racinos have been on the rise in the last decade. For this report, we have tracked the opening dates of each casino in fifteen of the seventeen states with commercial casinos and for each racino that is operational in thirteen states. At the end of fiscal year 2015, there were 160 commercial casinos in fifteen states and fifty-five racinos in thirteen states (see Table 2). Nearly one-third of all 160 casinos and around 56 percent of all fifty-five racinos were opened in the last decade. As shown in Table 2, before fiscal year 1991, there were very few casinos around the nation outside of Nevada. About 50 percent of all casinos and racinos outside of Nevada and South Dakota were opened since 2001.
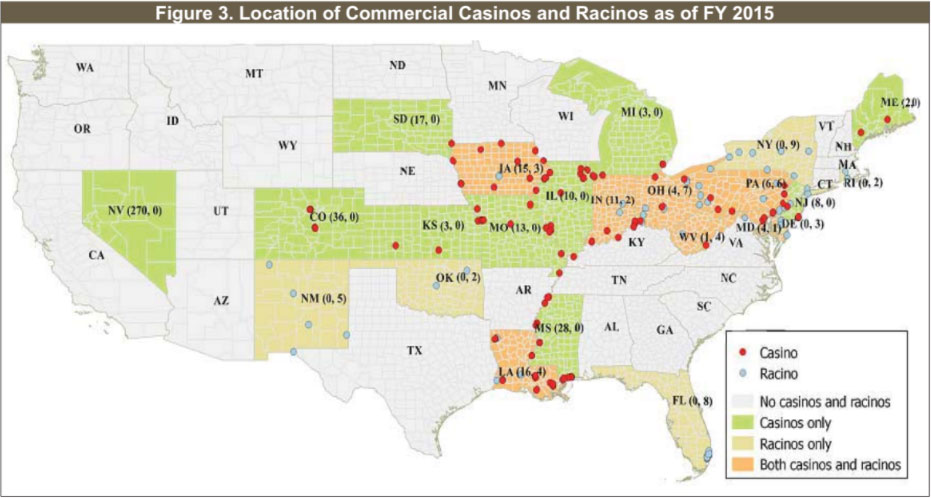
Commercial casinos are more prevalent in eastern states and less prevalent in western states. Figure 3 shows the geographical location of commercial casinos and racinos by state. Most states usually open casino and/or racino facilities near their borders with other states to take advantage of border state-consumers. In addition, Figure 3 shows that quite a few casinos are located along the Mississippi river.
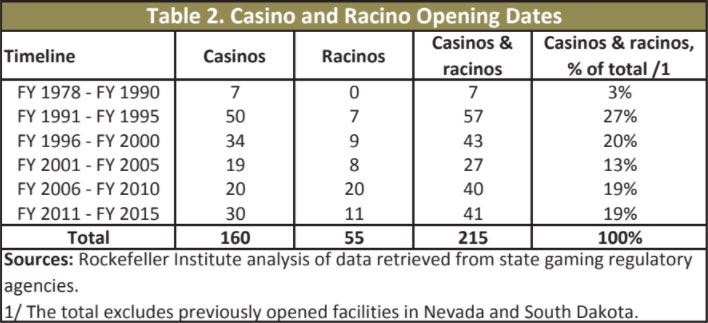
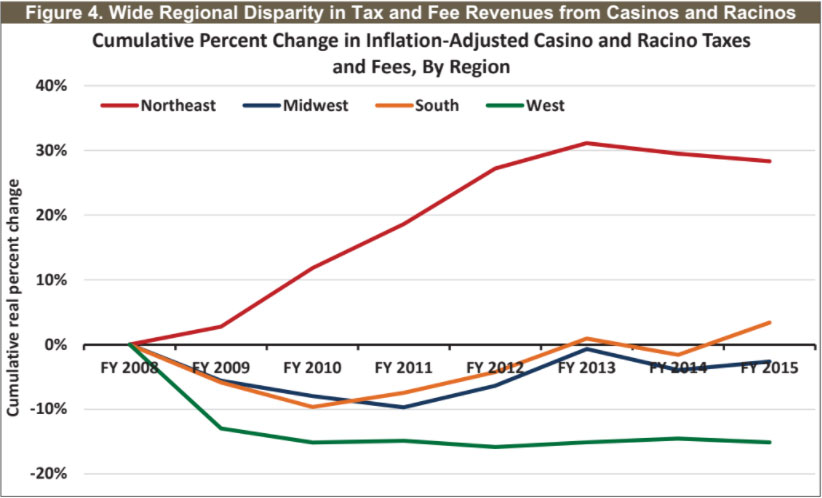
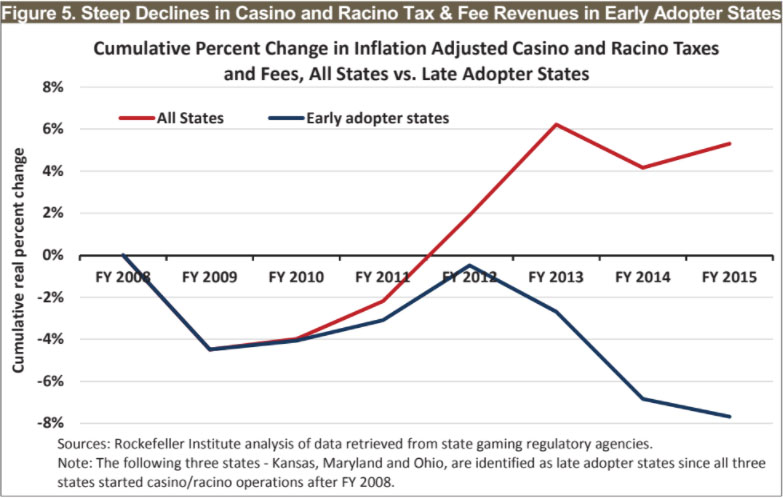
Figure 4 shows cumulative percent change since the Great Recession in inflation-adjusted tax and fee revenues for all commercial casinos and racinos by region.22 Tax and fee revenues from casinos and racinos are still below the prerecession levels in the Midwest and West regions and only slightly above the prerecession level in the South. The modest growth in the South is mostly attributable to a single state, Maryland, which legalized casino and racino operations only in 2008. The Northeast experienced steep growth in revenues from casinos and racinos since the start of the Great Recession, although the growth has softened in the last two fiscal years. The large growth in casino and racino revenues in the Northeast is almost exclusively attributable to a single state, Pennsylvania, and to a single racino located in New York City. Pennsylvania legalized casino and racino operations in 2004 and opened five racinos in fiscal year 2007. In addition, Pennsylvania opened an additional racino and six casinos since fiscal year 2008. While racinos in New York were operational since fiscal year 2004, the facility located in New York City was opened only recently, in fiscal year 2012. Figure 5 shows cumulative percent change in inflation adjusted casino and racino tax and fee revenues for all states versus late adopter states. The blue line excludes Kansas, Maryland, and Ohio as all three states started the operations of casinos and racinos after fiscal year 2008. As shown on Figure 5, after excluding tax and fee revenues for Kansas, Maryland, and Ohio, revenues for the rest of the nation declined steeply, particularly in the last three years. At the end of fiscal year 2015, casino and racino tax and fee revenues were 7.7 percent below the prerecession levels.
It is clear that the expansion of casino and racino operations leads to some growth in total revenues, but that much of the growth in expansion states appears to come at the expense of already-established operations. We see this clearly in data for casinos in Appendix Table 8. However, the growth is not sustainable and the evidence indicates that Americans are spending much less on gambling than they used to.23 The Great Recession and its anemic recovery had a big impact on consumer discretionary spending behavior, including spending on gambling activities. Moreover, baby boomers have far less retirement savings after the 2008 stock market crash and Millennials and Generation Xers simply don’t gamble as much as the baby boomers do.
Commercial casinos are operated by businesses and taxed by the states. Currently, nineteen states have legalized commercial casinos and as of the writing of this report, they are operational in eighteen states (see Appendix Table 6). Six of those nineteen states legalized commercial casino operations during or after the Great Recession. Maine, Maryland, Ohio, and West Virginia have all legalized casino operations since the start of the Great Recession. In addition, casino operations were legalized in Massachusetts and New York. Massachusetts had legalized casino operations in 2011 and opened the first casino in June 2015. New York had legalized casino operations in 2014 and expects to open four destination casino resorts.
At the end of FY 2015, there were about 450 casinos operating in seventeen states. Twenty of those casinos were located in the states that are new to the casino world and started casino operations during or after the Great Recession. Moreover, some states introduced table games at their casino facilities in the hopes of raising more revenues. Despite geographic expansion of casino operations and despite efforts to make casinos more attractive, tax revenues from casino operations did not pick up the growth that many state officials were hoping for. Three states — Colorado, Mississippi, and New Jersey — had closed the doors of some casinos in fiscal year 2015, mostly due to declining revenues and competition from neighboring states.
One state, Nevada, is home to 60 percent of U.S. casino facilities and in fiscal 2015 collected about 17 percent of all state revenue from commercial casinos nationwide, despite a tax on casino activity that is relatively low. Pennsylvania and Indiana also collected relatively large shares of overall casino revenue, at 11 and 9.5 percent, respectively, in fiscal 2015. Casino tax rates vary widely across the states from as low as 0.25 percent in Colorado to as high as 67 percent in Maryland (see Appendix Table 7). The early adopters of commercial casinos, such as Nevada and New Jersey, have much lower tax rates compared to late adopters of commercial casinos such as Pennsylvania or Maryland. In fact, the states that legalized commercial casinos post-2000 have much higher tax rates at or above 27 percent.
Among the rest of the states, nine states have much lower tax rates, at or below 22 percent. Illinois and Indiana are the only two early adopter states with higher commercial casino tax rates. In Illinois, the top tax rate is 50 percent for casinos with over $200 million adjusted gross revenues, while in Indiana the top tax rate is 40 percent for casinos with over $600 million adjusted gross revenues. Illinois has a long history of legislated tax changes for casinos. Casino tax rates in Illinois were flat at 20 percent until 1997. In 1998, the Illinois legislature implemented a graduated tax rate ranging from 15 percent to 35 percent for five brackets. In 2002, the Illinois legislature revised the commercial casino tax structure, added two more brackets with a top rate at 50 percent to address revenue shortfalls caused by the 2001 recession. In 2003, casino tax rates were revised once again and the legislature added a top rate at 70 percent. The legislature reduced top rate from 70 percent to 50 percent in 2005.
Casino tax structures went through legislated changes in Indiana as well. Before 2002, the casinos in Indiana were taxed at a 20 percent flat rate. In 2002, the legislature in Indiana introduced a graduated tax rate for casinos ranging from 22.5 percent to 35 percent for five brackets. The legislature once again revised casino tax structures in 2007 and added an additional bracket with a 40 percent tax rate. In addition to tax rates charged on adjusted gross revenues, some states also charge admission fees or gaming device fees or some other local fees. Moreover, most states adopted different tax rates for table games that are usually at a lower rate.
States use tax revenues collected from casinos for various purposes ranging from addressing issues created by problem gambling to education (see Appendix Table 7). Appendix Table 8 shows state-by-state inflation-adjusted revenue collections from commercial casinos for fiscal years 2008-15, percent change in casino revenues between 2014 and 2015, compound annual growth rates between 2008 and 2015, and percent and dollar change in casino revenues between 2008 and 2015. The states are divided into two groups: the “older” casino states and the “new” casino states. The “older” casino states include those states that had casino operations in place before fiscal year 2008, while the “new” casino states include states that opened casinos in fiscal year 2008 or beyond.
In fiscal 2015, states took in just less than $5.4 billion from commercial casinos, nearly as much as in fiscal year 2014. Revenues declined in nine of seventeen states with commercial casinos in fiscal year 2015. West Virginia and Indiana reported the largest declines at 18.1 and 7.8 percent, respectively. The large declines in both states are mostly attributable to the opening of casinos and racinos in the neighboring state, Ohio, in fiscal year 2012. One of Ohio’s four casinos is located in Cincinnati, which is in close proximity to three of Indiana’s eleven casinos, ranging only from twenty-five to fifty miles away. The largest growth was reported in Maryland, where collections grew by 17.1 percent. The strong growth in Maryland is mostly attributable to the opening of a new casino in fiscal 2015. If we exclude Maryland, collections for the remaining sixteen states show a decline of 1.2 percent in real terms.
For the nation as a whole, the compound annual growth rate was negative 0.2 percent between fiscal years 2008 and 2015. Moreover, the compound annual growth rate was negative 4.4 in the “older” casino states. Pennsylvania opened its first casinos in fiscal year 2008 and the growth is mostly attributable to the opening of new casinos during the period between 2008 and 2015.
Inflation-adjusted tax and fee revenues from casinos declined by $83 million or 1.5 percent for the nation between 2008 and 2015. The “older” casino states saw much deeper declines at 26.9 percent. Declines were reported in all “older” casino states, indicating that casinos in those states either reached saturation or have been cannibalized by “new” casino states. The regional competition for casino tax dollars is at its height, particularly for the northeastern region of the nation. When Pennsylvania legalized and opened the doors to casino and racino operations in mid-2000s, casino revenues in New Jersey saw declines and officials in New Jersey put the blame on the new competition in neighboring Pennsylvania. Pennsylvania enjoyed the boom of tax revenue growth from casino and racino operations for the next few years, until the neighboring states, Ohio and Maryland, legalized and opened their own casinos and racinos. Officials in Indiana blamed Ohio for the declines in casino tax revenues. While the Great Recession had a big impact on state tax revenues in general, we believe that the softening of revenues from casino operations is mostly attributable to market saturation.
Tax and fee revenue from racinos represents the fastest growing element in states’ gambling portfolio. At the end of fiscal year 2015 there were fifty-five racino facilities in thirteen states, with nine operating in New York and six in Pennsylvania (see Appendix Table 9). Six of thirteen racino states—Delaware, Maryland, New York, Ohio, Rhode Island, and West Virginia — host VLTs.
The format of racinos evolved over time. Many racinos now offer table games. In addition, some racinos no longer offer much or any live racing events. For example, the two racinos in Rhode Island were the forerunner of the racinos but they no longer offer any live racing events.
Racino tax rates, just like casino tax rates, vary widely across the states from as low as 10 percent in Oklahoma to as high as 70 percent in New York (see Appendix Table 10). However, unlike casino states, the high tax rates in racino states are not tied to the late legalization dates. Nine of thirteen racino states have a flat tax rate, while the remaining four states — Indiana, Iowa, New York, and Oklahoma – have graduated tax rates. In some states, such as New York and Rhode Island, the tax rate varies from one facility to another. The tax revenues collected from racino operations are earmarked for various purposes including education, infrastructure, property tax relief, tourism, and other state and local government services. Appendix Table 11 shows state-by-state inflation-adjusted revenue collections from racinos for fiscal years 2008-15, percent change in racino revenues between 2014 and 2015, compound annual growth rates between 2008 and 2015, and percent and dollar change in racino revenues between 2008 and 2015. The states are again divided into two groups: the “older” racino states that had operations in place before fiscal year 2008 and the “new” racino states that opened racinos in fiscal 2008 or beyond.
In fiscal year 2015, states took in $3.3 billion from racinos. State and local government inflation-adjusted revenues from racinos increased by 2.9 percent in fiscal 2015 compared to fiscal 2014. Revenues declined in seven states. Delaware reported the largest declines at 9.1 percent, followed by Iowa and Louisiana at 3.5 and 3.0 percent, respectively. Ohio reported the highest growth at 74.4 percent, primarily attributable to the opening of two new racinos during fiscal 2015. If we exclude Ohio, inflation-adjusted tax revenues from racino operations show a 0.5 percent decline nationwide from fiscal 2014 to 2015.
For the nation as a whole, the compound annual growth rate was 2.5 percent between fiscal years 2008 and 2015. However, the compound annual growth rate was only 0.6 percent in the “older” racino states. The compound annual growth rate was negative in six of the ten “older” racino states. Indiana opened its first racinos in fiscal 2008 and the growth is mostly attributable to the opening of new racinos between 2008 and 2015. Inflation-adjusted tax and fee revenues grew by $0.5 billion or 18.6 percent for the nation and 4.6 percent for the “older” racino states between 2008 and 2015. Declines were reported in six “older” racino states. New York had the largest growth in terms of dollar amount between 2008 and 2015, mostly attributable to the opening of the racino in New York City.
In fiscal 2015, about 28 percent of nationwide racino revenues were collected in a single state, New York, and another 23 percent were collected in Pennsylvania. Racino revenues in New York nearly doubled between fiscal 2008 and 2015, mostly due to opening of a new racino in New York City in October of 2011. The revenue collections in the New York City racino represent 40 percent of all racino revenues in the state of New York. The opening of the new racino in New York City certainly created competition for racinos in the neighboring state Pennsylvania, particularly for those racinos that are located in the eastern part of the state. Revenues from racino operations in Pennsylvania showed steady declines since 2011. While revenues from racinos increased significantly between 2008 and 2015, particularly compared to the growth rates in lotteries and casinos, such growth is mostly attributable to legalization of racino operations in three states — Indiana, Maryland, and Ohio — as well as opening of new racino facilities in other states.
Native American casinos are run by tribes and operated on Indian reservations. In 1987, the U.S. Supreme Court recognized that Native American tribal entities could operate gaming facilities free of state regulation. A year later, in 1988, Congress enacted the IGRA to provide terms and conditions for gambling on Indian reservations. States usually do not have authority to regulate or profit from these Indian casinos. However, some states have negotiated special revenue sharing agreements with the tribes. Currently, there are around 400 Native American casinos operated by over 200 tribes in twenty-eight states.
Comprehensive data on state revenue from Native American casinos are not available. However, we provide data for seven states that have the largest share of the Native American casino revenue collections. We estimate that total state collections from Native American casinos are under $2 billion for the nation. Appendix Table 12 shows inflation-adjusted revenue collections from Native American casinos for seven states for fiscal years 2008-15, percent change in Native American casino revenues between 2014 and 2015, compound annual growth rates between 2008 and 2015, and percent and dollar change in Native American casino revenues between 2008 and 2015. The seven states for which we provide data comprise at least half of the nationwide revenue collections from the Native American casinos. The state of Florida signed an agreement with the Seminole Tribe of Florida in late 2010 and as part of the agreement the Tribe shares revenues with the state.
Inflation-adjusted revenues from Native American casinos declined by 4.6 percent in fiscal year 2015 compared to 2014 in the seven states for which we have data. Three out of seven states reported declines. The compound annual growth rate between fiscal 2008 and 2015 was a 0.6 percent decline in real terms for the subtotal of seven states with Native American casinos. Inflation-adjusted compound annual growth rates were negative in five states. We do not report compound annual growth rates for Florida since the Tribe in Florida started sharing revenues only starting fiscal year 2010. Inflation-adjusted revenues for the subtotal of seven states declined by $42.5 million or 4.0 percent between 2008 and 2015. Declines were reported in five of the seven states.
The overall trends over the past eight fiscal years indicate that the growth in tax and fee revenues from major types of gambling have not kept the pace with the growth in state and local government tax collections and overall economy. Moreover, the trends indicate that the growth in gambling revenues is mostly driven by the expansion of gambling activities.
Appendix Table 13 shows state-by-state inflation-adjusted tax and fee revenues for fiscal years 2008 through 2015 for major types of gambling — lotteries, commercial casinos, racinos, pari-mutuel wagering, and video gaming machines. Appendix Table 13 also shows the inflation-adjusted percent change in gambling revenues between 2014 and 2015, compound annual growth rates between 2008 and 2015, and percent and dollar change in gambling revenues between 2008 and 2015. Compound annual growth rates varied widely across the states, with nearly half of the states reporting growth and the other half reporting declines. For the nation as a whole, the compound annual growth rate was 0.3 percent between 2008 and 2015.
Inflation-adjusted tax and fee revenues from gambling grew by 1.8 percent or $0.5 billion for the nation as a whole. Twentythree states saw declines in overall inflation-adjusted gambling revenues between 2008 and 2015. The growth in the remainder of the states was mostly driven by the legalization or expansion of one or another kind of gambling activity. For example, the largest growth in terms of dollar amount was in Ohio and Pennsylvania where inflation-adjusted gambling revenues increased by $0.5 billion each. The strong growth in both states is primarily due to legalization and operation of commercial casinos and racinos in the recent years. If we exclude Ohio and Pennsylvania, inflation-adjusted gambling revenues show a decline of 2.1 percent for the rest of the nation between 2008 and 2015. The trends speak for themselves: Gambling is not a reliable and sustainable source of revenue for the states. Moreover, there are various tangible and intangible costs associated with the gambling, which is the topic of the next section.
Gambling is not just any other kind of entertainment. It creates costs that are paid by all taxpayers and not just by gamblers. Therefore, gambling is a rather controversial public policy topic. Supporters of gambling argue that it promotes local economic development. Opponents of gambling argue that gambling, particularly existence of casinos and racinos, leads to a higher crime and bankruptcy rates in the local community. Supporters of gambling argue that it creates employment. Opponents argue that gambling does not provide competitive or useful workforce skills. Supporters of gambling argue that it is a voluntary type of entertainment that is socially engaging. Opponents argue that a proportion of gamblers develop addiction problems, which results in tangible and nontangible costs.
If the benefits of gambling are not clear, and if the costs of gambling are too high, why do state legislators legalize gambling? As Earl Grinols pointed out twenty years ago, “The answer is partly that the costs do not appear instantaneously, partly that those who make money from gambling do not bear the costs they impose on others, and partly that gambling creates a classic regional Prisoner’s Dilemma problem: Everyone is best off if no one has gambling, but one region can sometimes gain at another’s expense if it deviates from the agreement to prohibit gambling everywhere.”
Expansion of gambling leads to potential social costs, which in turn leads to economic costs. Some researchers have developed classifications of problems associated with gambling such as problem or pathological gambling, bankruptcy, crime, mental illness, suicide, regulatory costs, family costs, arrests, job loss, divorce, poor health, etc. The purpose of this report is not to study social costs associated with gambling, but to provide a brief review of social costs that are salient. More specifically, we will briefly review the social costs related to problem and pathological gambling, bankruptcy, and crime.
The social and economic costs related to problem and pathological gambling are reportedly substantial but hard to measure. There is a growing body of research studying the costs associated with problem and pathological gambling. Researchers usually attempt to study and measure social and economic costs that have “negative externalities” such as bankruptcy, crime, job loss, suicide, arrest, etc. The results of these studies are divergent and the findings remain inconclusive. Moreover, the estimates of cost vary widely. The differences in findings are often attributable to the differences in measurement criteria and the challenge of measuring certain intangible costs such as depression, the differences in the methodology, etc.
Mallach distinguishes three different categories of costs associated with problem gambling: (1) costs borne by the problem gamblers themselves, (2) costs borne by the family and friends of the problem gamblers, and (3) costs borne by society.31 The first category of the cost is not classified as a social cost since the gambler voluntarily and knowingly exhibits gambling behavior. The second category of costs is external, but is hard to quantify or measure. Researchers usually study the third category of costs: Costs that impose medical, police, legal and other social costs on society.
Based on criteria developed by the American Psychiatric Association, the authors of a report to the National Gambling Impact Study Commission reported that there are approximately 2.5 million adults in the United States that are pathological gamblers and another three million that are problem gamblers. Moreover, another fifteen million adults are at risk for problem gambling. “Costs that could be measured on an annualized, present-value basis (poor physical and mental health, job losses/unemployment) sum to about $1,200 and $700 for each pathological and problem gambler, respectively.”33 According to Goodman, “The minimum estimated average cost to the combined public and private sector economies of a state is about $13,200 per problem gambler, per year.” Despite the differences in research findings, one cannot deny that there are substantial social and economic costs related to problem and pathological gambling.
The economics literature supports the argument that gambling activities, particularly lottery activities, are regressive in nature and attract poorer population. Therefore, gambling often leads to reduction of disposable income for low-income households, particularly at a time when their income is not growing and is even declining in real terms.
Several studies examined the possible impact of gambling on bankruptcy rates. The literature is divided on the relationship between casino/racino operations and bankruptcy rates. Some empirical studies found no significant relationship between casino operations and bankruptcy rates.35 Study results conducted by Grote and Matheson reveal more mixed results. They used panel data from 1983 to 2010 and examined the relationship between legalized gambling and two types of bankruptcies: business versus personal. The authors find no correlation between legalized gambling and business bankruptcies. According to the authors, “States that adopted lotteries and casinos prior to 1995 experienced significantly higher personal bankruptcy rates while the effect of lottery and casino adoption on personal bankruptcies has disappeared since that time.”36 A study conducted by Nichols, Stitt, and Giacopassialso reveal mixed results. The authors examined per capita personal bankruptcy filings in eight jurisdictions that had adopted gambling compared to a set of matching control jurisdictions. Their study results revealed mixed results: Per capita bankruptcy filings increased in seven of eight jurisdictions with casino operations (in five of the seven, the increase was statistical significant) and decreased significantly in one jurisdiction.
Other studies, however, reveal a statistically significant relationship between casino and other gambling operations and bankruptcies. For example, Goss, Morse, and Deskins utilize county-level data for 1990-2005 and reveal that there is a correlation between the presence of casinos and the bankruptcy rates. However, “the effect of a casino on bankruptcy may differ over the casino’s lifespan. Results confirm this possibility, indicating that the impact of casinos on bankruptcy follows a ‘U-shaped’ curve over the life of the casino.”38 More specifically, study results by Goss, Morse, and Deskins indicate that the existence of a casino in a county substantially increases the bankruptcy rate in the first year of operation, followed by lower and declining bankruptcy rates during the second through seventh years after opening, and increasing once again in the eighth year and thereafter.
Economists Garrett and Nichols from the Federal Reserve Bank of St. Louis raised the question of whether casinos export bankruptcy. While most previous studies examined the impact of local casinos on local bankruptcies, the study by Garrett and Nichols took a different approach and examined trends in bankruptcy rates in the gamblers’ home county. The authors found “strong evidence that states having more residents who visit out-of-state casino resorts have higher bankruptcy filings.”
There is a growing body of research examining the relationship between casino/racino operations and crime associated with casinos and racinos. The results are varied. Opponents often argue that the introduction of casinos and racinos leads to increased crime rates in the host communities, while proponents argue that legalization of casinos and racinos actually reduces the crime rates as it reduces illegal gambling activities. In 1999 the National Council of Legislators from Gaming States established an eleven-member Public Sector Gaming Study Commission (PSGSC) that was comprised of state and local government leaders. The goal of the PSGSC was to objectively study issues related to the growth and expansion of gambling. In its final report, the PSGSC, among other issues, discussed the relationship between gambling and crime. According to the
PSGSC final report, “Though much of the evidence that is available is anecdotal, the majority of the information collected during the past decade indicates that there is no link between gambling, particularly casino-style gambling, and crime.”41 The authors of the report argue that it is not the existence of casinos and gambling related activities that generates crime, but the mere fact that casinos bring in more visitors into the local community and the increased volume of people might lead to more crime. Basham and White examined aspects of legalized gambling, including social and economic costs, in the following four countries: Australia, Canada, the United Kingdom, and the United States. According to the authors, the social benefits of gambling are underappreciated, the social costs are overstated, and the economic benefits outweigh the economic costs. “A common misconception about gambling is the perceived association between gambling facilities and the incidence of crime.”42 Based on the literature review, the authors argue that the crime rates dropped in all four countries, despite the proliferation of casinos.
Grinols and Mustard used county level data between 1977 and 1996 to examine the relationship between casinos and associated crime. The authors discussed the theoretical connections between casinos and crime as well as discussed factors through which casinos reduce crime as well as increase crime. They focused on the intertemporal effect of casinos and concluded that the effect of casinos on crime is low in the early years of casino operations but grows over time. The authors conclude that between 5.5 and 30 percent of the different crimes in casino counties is associated with the presence of casinos, which in turn translates into social crime costs. More specifically, “8.6% of property crime and 12.6% of violent crime in counties with casinos was due to the presence of the casino.”
Since gambling is a rather controversial public policy issue, so are the research results. An example is Walker’s criticism of Grinols and Mustard article. Walker does not reject the fact that there is a link between casinos and crime. He states, “Overall, my research leads me to believe that there is some evidence that casinos may have a positive economic effect in the short-term, but the long-term effects are less certain.”44 However, Walker argues that the crime rates associated with casinos are likely overstated by Grinols and Mustard. Walker argued that the most significant problem with Grinols and Mustard paper is the measurement of the crime rate that does not count tourists, who often are popular targets for criminals. According to Walker, “… if one is considering a very small area, such as a county that has a large tourist attraction, then for the crime rate to represent accurately the risk of being victimized, it must be adjusted to account for the crimes committed by visitors and for the increase in the population at risk of being victimized by crime.”
In a follow-up study, Walker argues that differences in research findings associated with the costs related to casino operations is mostly due to differences in measurement criteria. Moreover, most of the research on gambling is done by researchers with a wide range of backgrounds encompassing psychology, sociology, law, public policy, public administration, political science, economics, etc. According to Walker, “…based on an overview of the literature, there is no conclusive evidence on the relationship between casinos and crime. More careful econometric analyses are needed.”
To make things more complicated, Mallach argues that the salience of accounting for visitor population for studying the relationship between casinos and crime depends on the measurement criteria. If the criteria is the incidence of crime, than certainly the visitor population should be considered. However, if the criteria “is the cost incurred by the public sector to deal with crime within the jurisdiction, it may be less relevant.”47 Moreover, the social costs of crime could go up even if the incidence of crime goes down. In other words, the perception that there is a correlation between casinos and crime, leads to a perception of increased frequency of criminal acts and results in unnecessary social and economic costs, such as decline in property values in the vicinity of casinos, outmigration, etc.
In summary, the social and economic costs associated with gambling are often hard to measure. However, the benefits of gambling should be viewed along with the costs of gambling both at state and local levels.48 Even if it is hard or often impossible to precisely measure the social costs associated with gambling, neglect of such costs is not an option. Moreover, due to the changing nature of gambling activities and expansion of gambling, researchers should revisit and revise the measurement criteria, conceptual frameworks and models for estimating the social and economic costs and benefits associated with different forms of gambling.
Discussions surrounding gambling expansion policy often raise the issues of saturation and substitution. In general, saturation refers to the peak or flattening of all types of gambling activities while substitution refers to the shift in spending on one type of activity to another type. The substitution effect is also often referred as cannibalization. We can separate three different types of substitution: (1) substitution of spending on one type of gambling activity with another type (for example, the shift of spending on lottery to casinos); (2) the substitution of spending on any discretionary spending activity with gambling activity (for example, the shift of spending on cinemas to casinos or lotteries); and (3) the substitution of spending on the same gambling activity within different geographic locations (for example, the shifting of consumer spending on casinos in New Jersey to casinos in Pennsylvania).
Several scholars argued that the gambling market in the United States has either saturated or is fast reaching saturation,49 while others argued that the expansion of gambling leads to a substitution effect. Over two decades ago, Cook and Yale warned that the casino gambling might follow the experience of lotteries and face problems of saturation and even decline. “Tax revenues may be diluted due to saturation resulting from the proliferation of locations and cross-border cannibalization of a finite pool of gaming participants.”
There is a growing body of literature examining the substitution effect in the context of gambling. For example, Elliott and Navin used pooled cross-section data for the period from 1989 to 1995 to examine the impact of casinos and pari-mutuel betting on lotteries. Their findings suggest that there is a significant cannibalization of lottery revenues by casinos and pari-mutuel betting. The authors argued that states still benefit from having both casinos and lotteries. However, states lose revenues from the substitution of lottery revenues by pari-mutuel betting.
Kearney investigated the impact of the introduction of state lottery on household spending. Her empirical analysis is based on micro-level expenditure data from 1982 to 1988, during which time twenty-one states had implemented lotteries. According to Kearney’s study results, spending on lotteries substitutes for other forms of discretionary spending, and not for alternative types of gambling. “The introduction of a state lottery is associated with a decline in household expenditures on non-gambling items of $137 per quarter…. The response is most pronounced for low-income households, which on average reduce non-gambling expenditures by approximately 2.5 percent. The impact of a state lottery is found to be more pronounced if no bordering state previously implemented a lottery and if instant games are offered. In addition, the decline in non-gambling consumption is sustained in the long run.”
The expansion of casinos in recent years spurred concerns among policy makers about the “cannibalization effects” within the casino industry itself. Several studies examined the cannibalization effect of casinos within certain geographic regions, including Illinois, Missouri, and Pennsylvania.
Gallagher examined the cannibalization effects within the casino industry in Illinois region, using panel data covering every commercial casino in or around Illinois between 1994 and 2006. His research findings show strong evidence of cannibalization effects between competitors. “Evidence suggests cannibalization effects do indeed exist and are largely a function of new casino development, not the expansion of pre-existing casinos. These effects also attenuate rather quickly with distance.”
Walker and Nesbit conducted a similar study for the casinos in Missouri region. The authors used quarterly data for all Missouri casinos for the time period spanning from 1997 to 2010 with the purpose of examining how competing casinos affect the revenues of a particular casino. Their study results indicate that “ casinos are competitive in nature (i.e., are substitutes), as there is no evidence to suggest that there is any positive agglomeration effect from casinos being clustered.”
Condliffe conducted a study examining Pennsylvania casinos’ cannibalization of regional gambling revenues, particularly for neighboring states Delaware and New Jersey. The purpose of the study was to examine the growth in the total casino gambling in the three states as well as whether casinos in those states cannibalize each other’s gambling revenues. The study results indicate that “in the area of arguably the greatest competition (the Southeastern Pennsylvania-Atlantic City-Delaware Park market) the impact of Pennsylvania gambling may have reduced overall revenue.”
Revenue from legally sanctioned gambling plays a small, but politically important, role in states’ budgets. States are most likely to expand gambling operations when tax revenues are depressed by a weak economy, or to pay for new spending programs. Many states expanded and encouraged gambling during and after the Great Recession in response to historic declines in tax revenues. Still, the growth in revenue collections from gambling is not nearly as strong as it once used to be.
The softening in the growth in gambling revenues is partially due to the impact of the Great Recession and due to changing consumer behavior in most recent years. In the wake of the Great Recession, many consumers became more conservative in their spending behavior, particularly when it comes to discretionary spending.56 Since spending money on gambling activities is discretionary, consumers are less likely to spend significantly more on gambling despite the expansion of gambling activities.
The recent geographic expansion of gambling created stiff competition, particularly in certain regions of the nation where states and facilities are competing for the same pool of consumers. Therefore, the weakening of the growth in gambling revenues is also attributable to market saturation and industry cannibalization. For example, Pennsylvania enjoyed strong growth in revenues from casino and racino operations until the opening of new casinos and racinos in neighboring Maryland, New York City, and Ohio. If history is any lesson, gambling is only a short-term solution to state budget gaps. Gambling legalization and expansion leads to some revenue gains. However, such gains are short-lived and create longer-term fiscal challenges for the states as revenue growth slows or declines. In addition, gambling is associated with social and economic costs that often are hard to quantify and measure.